Gauge Views
A gauge view represents a single query result at a time as one or more SCADA-style gauges. You can toggle which query result to show on the gauges using a Row Guide. The Map Views page covers the usage and creation of row guides in detail, but in short, a row guide displays a list of all query results on the report page, each identified by an Icon, Label, and Description. By default, the gauges on a report page are automatically set to the values of the first query result in the list, but by clicking on the icon of any other result in the row guide, the values of the gauges change to reflect the values of the selected result. Just like for a map view, you can configure the row guide of a report by using the left half of the "Display As" section of the Queries & Reports page.
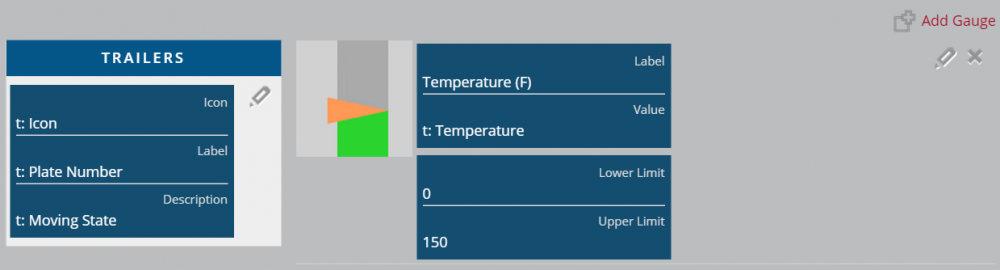
The right half of this section contains a list of all gauges defined for the current view, with the standard edit and delete buttons for each gauge. The "Add Gauge" button brings up the following panel, on which you can configure a new gauge.
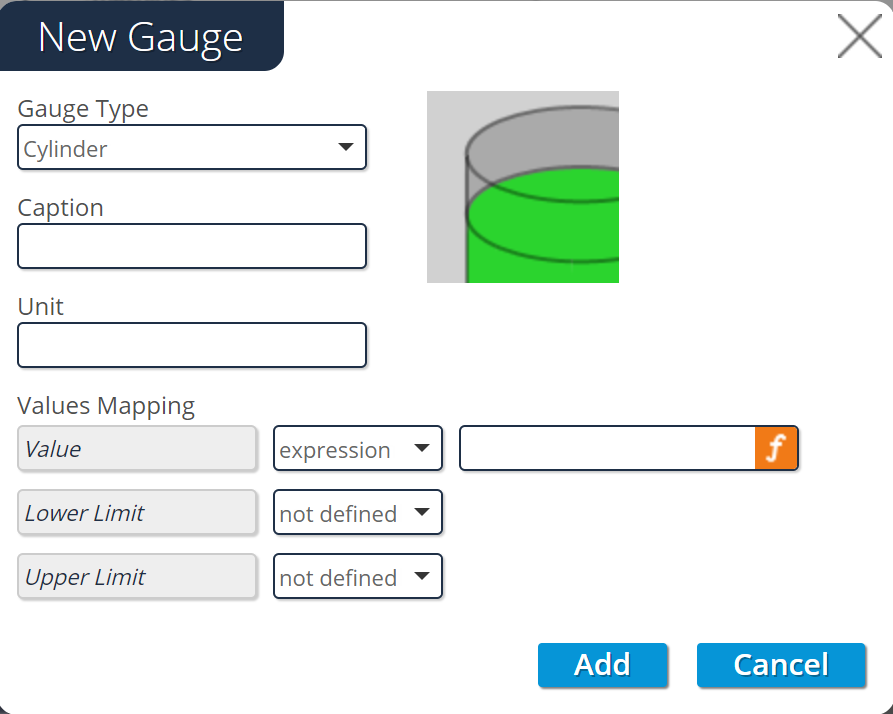
The Gauge Type field controls the appearance of a gauge, but not its functionality; it simply determines whether the gauge appears as one of the following types:
- barometer
- cylinder meter
- linear meter
- speedometer
- thermometer
The Gauges page shows examples of each of these gauge types at runtime, but the icon in the upper right of this panel (as well as on the list of gauges on the Queries and Reports page) shows a quick preview of the appearance of the selected gauge type.
The Caption field determines the label placed upon a gauge at runtime, so as to identify which value of the query result populates the gauge.
The Unit section allows users to optionally enter a static unit of meausure for the gauge value - making it easier to read the gauge
The Value attribute determines which target field or EL expression the gauge will display a
The Lower Limit and Upper Limit fields control which range of values can actually be displayed on the gauge. If the value of the Value attribute for a query result is below the specified Lower Limit, the gauge will appear as empty, and if it is above the Upper Limit, the gauge will appear as completely full. If the value lies between these two limits, the gauge will be filled proportionally based on the value's placement between the limits; for example, if a gauge has limits of 50 and 100, respectively, and a query result yields a value of 80, the system will fill the gauge up to 60% of full.