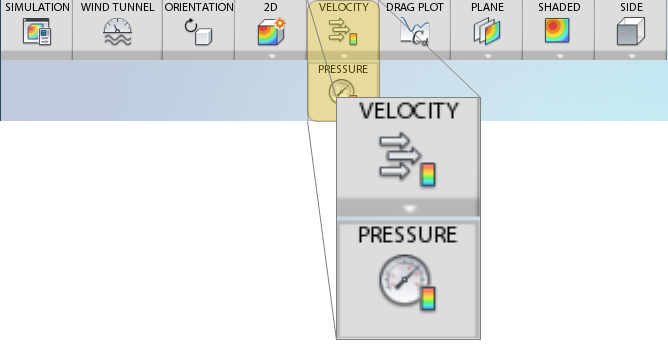
Select either velocity or pressure to be displayed on the plane, flow lines, or iso surface (for 3D).
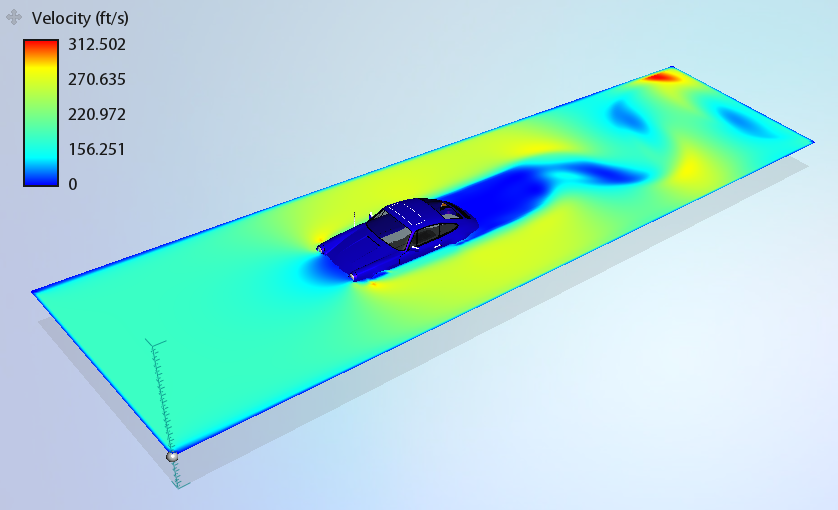
Select Velocity to show the wind speed and direction. Velocity indicates how the air moves around the model. Shaded planes represent wind speed with color. Planes with vectors as well as Flow Lines show direction as well. Higher velocity regions are shown as red (in the default legend), and indicate accelerating flow. Such flow is often "squeezed" between boundaries or is offset by lower velocity regions such as wakes. Lower velocity flow is shown as blue, and indicates flow that may be decelerating or stagnating.

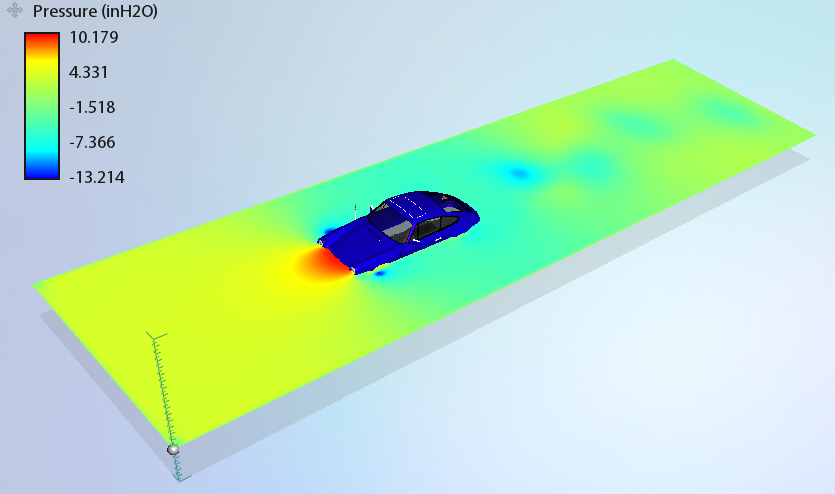
Select Pressure to show the pressure distribution throughout the flow. This is useful for understanding where the wind impinges on the model (high pressure) and where it accelerates (low pressure). Pressure is a good indicator of drag, also known as wind resistance, of an object. Models that have large pressure differences may be exhibiting higher levels of drag.
