2D Plots
For nonlinear simulations, such as Nonlinear static stress or Event simulation, 2D charts are plotted which show the result versus the calculation step throughout the simulation event. Click the 2D Chart icon  to the right of the Step slider to see the plot:
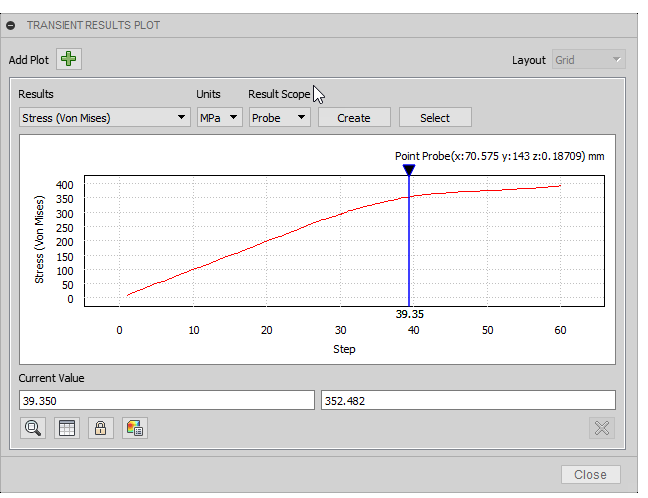
2D charts have the following capabilities:
- The Results drop-down menu changes the result displayed in the chart.
- The Units drop-down menu changes the unit of display.
- Result Scope enables you to look at the global stress in the analysis display results from a point probe.
- If points are selected there are options to create new probs or select probes previously created.
- The chart can be toggled to show the values in a table using the buttons on the table button on the bottom left corner of the dialog box
 ,
,  .
. - The point on the chart can reflect the time step in the model by syncronizing the plot with the graph
 ,
,  .
. - A chart can be quickly added to a report using the Report button
 .
.