Component temperature result
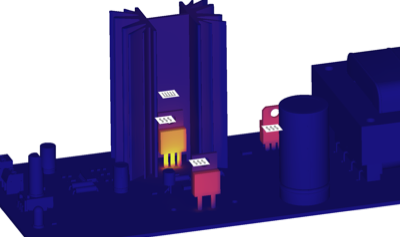
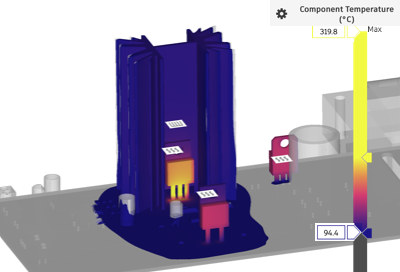
The Component Temperature result shows the temperature of all the components in the Simulation model, under the active conditions defined in the study setup.

Figure 1 Component temperature result with colors reflecting temperatures between 95C and 180C.
Things to look for
When viewing the Component Temperature result, watch for the following:
- Components that exceed the maximum temperature threshold and may require a thermal management strategy
- Components that are close to their maximum temperature threshold and may be sensitive to the temperature of nearby components
- The temperature of the heat sink and whether it might be more effective using a different material
- A component whose temperature is far below the expected temperature, possibly due to a modeling issue, such as contact.
Using this result
The Component temperature result uses a range of colors to indicate the region of lowest temperature in blue, to the region of highest temperature in yellow. The maximum temperature that the component reaches is indicated by the colors on the legend. Use the Component temperature result in conjunction with the Air temperature result.
Move the Range of interest sliders on the left of the legend bar, and the Threshold sliders on the right to narrow your focus, and make the color contrast more visible.

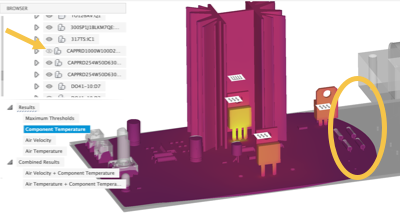
Hide a component on the board, for example if it's masking a component of greater interest, by toggling its
 visiblity in the Model components folder.
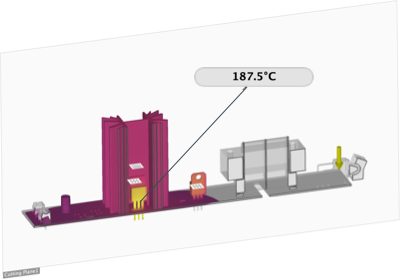
Use Surface probes, Point probes, and Cutting planes to inspect the result carefully.

Consider the fluid flow path and the position of thermal management components so air is drawn away from heat sensitive components
Strive to reduce the air temperature around heat sensitive components below their maximum temperature thresholds.
Next Steps
To address the potential issues highlighted by the Component Temperature result, you could:
- Switch board components for different ones that can tolerate higher temperatures
- Select a component that meets the performance requirements but requires a lower internal heat load
- Change the dimensions or material used in the heat sink
- Add a fan, if there isn't one
- Change the location of the fan to move the fluid flow path away from heat sensitive components
- Reverse the blowing direction of the fan.