Contour plots
In contour plots, the contour colors on the model are defined by the value ranges shown in the Legend. In most cases, areas that display in red are most critical. They represent high stress, high deformation, high temperature, or a low safety factor. Each results set gives you different information about the effect of the load on your part.
Smooth shading
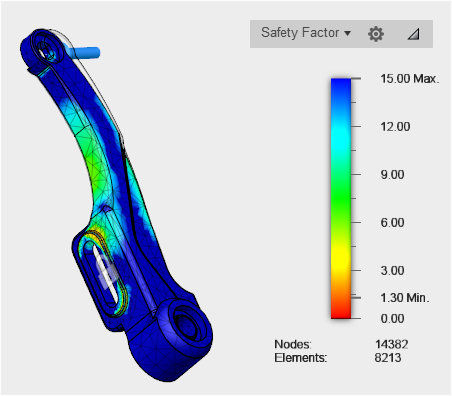
Smooth shading is the default plot presentation for all result types. Colors blend from one to the next.
Banded shading
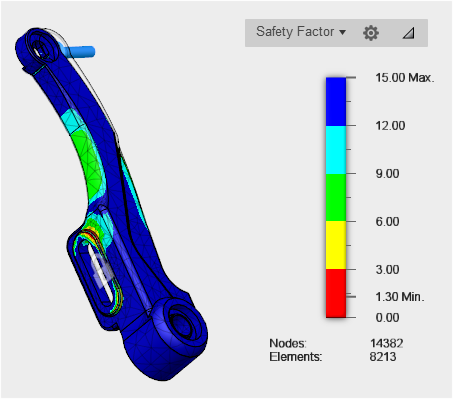
The contour plot presents the colors using a strict banding method. Color separation is clearly visible. This can be used to have a clear definition of the problematic area.
You can change the shaded display using the Legend Options dialog.
To access the Legend Options dialog, either:
- In the Results contextual tab, select Result Tools > Legend Options
 , or
, or - Click the Settings icon
 adjacent to the Legend.