Convergence plot
When you enable Adaptive Mesh Refinement, the solver produces a Convergence Plot result. Convergence Plots are available for the following study types:
- Static Stress
- Modal Frequencies
- Thermal
- Thermal Stress
To access this plot:
- For studies using the online results viewer (Static Stress, Thermal, Thermal Stress, and Modal Frequencies), on the Results tab, click 2D Plots > Convergence Plot.
- For studies using the standard results viewer, on the Results tab, select Result Tools > Convergence Plot.
Alternatively, right-click Results in the Browser, then select Convergence Plot.
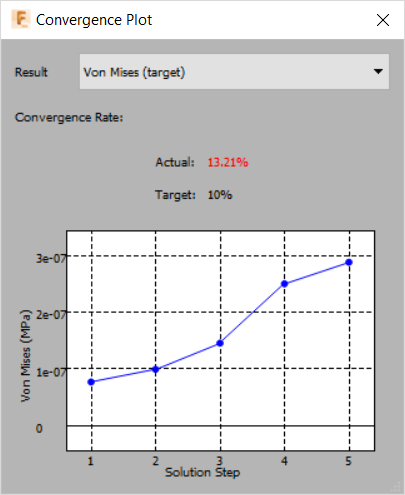
The Convergence Plot shows how the target result changes with each iteration of the solution. The actual change between the final two iterations and the target convergence tolerance are listed above the graph. You can also view how the other available results vary for each iteration.
The following items are contained in the Convergence Plot:
Result: Use the drop-down list to choose which result to graph. You can choose the same results as were available in the Results for Baseline Accuracy drop-down list when you set up Adaptive Mesh Refinement. The result on which the mesh refinements were based is tagged as the (target) result.
Convergence Rate:
Actual: The actual change in the currently displayed result between the final two solution steps, in percent.
Note: If the Maximum Number of Mesh Refinements was reached before the desired Results Convergence Tolerance was achieved, this value exceeds the Target value. The requested level of accuracy was not achieved.Target: TheResults Convergence Tolerance you specified when setting up Adaptive Mesh Refinement.
Graph: The graph displays the currently selected Result on the vertical axis and the Solution Step number on the horizontal axis. Point to a data point on the graph to display the precise result value at that point.