Change the simulation legend range of interest
Hide data outside a specific range of values so you can focus on the areas of interest in your results, or determine whether your model meets required specifications.
Prerequisites: You have run a simulation study and have results to view.
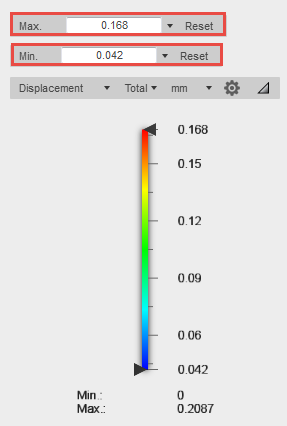
Narrowing the range of interest at the top and bottom of the legend hides the data outside that range, showing it as a wireframe instead. This effectively creates an iso surface out of the model, so you can see only the areas that fall within your range of interest.
Online viewer
- At the top of the legend, drag the Max slider down, or type a new value in the box next to it, to lower the upper value.
- At the bottom of the legend, drag the Min slider up, or type a new value in the box next to it, to raise the lower value.
Legacy viewer
Click
 (Simulation workspace > Results tab > Result Tools panel > Legend Min/Max) to open the Min/Max dialog.
Specify the desired maximum and minimum value.
Click Reset to reset the values to the default state.