Overview
The Golaem Performance Profiler lets you profile the performances of the Golaem layout. You can:
- find where is the CPU time spent when displaying or rendering a cache proxy
- display the layout cache activity (loaded/destroyed frame) and occupation (frames currently in cache or not)
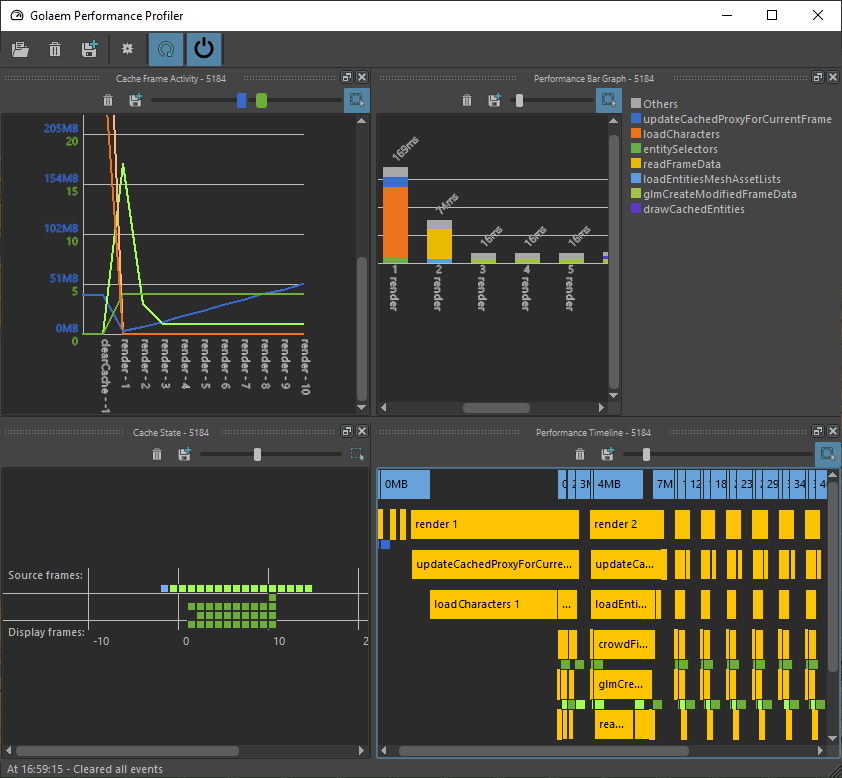
Golaem Performance Profiler main windows.
LAUNCH
- Golaem Render Menu: Performance Profiler
- MEL Command: openPerformanceProfiler;
- Stand Alone: ./scripts/glm/performanceProfiler/performanceProfilerStandAlone.py
Performance Profiler GUI
The performance profiler is composed of several parts:
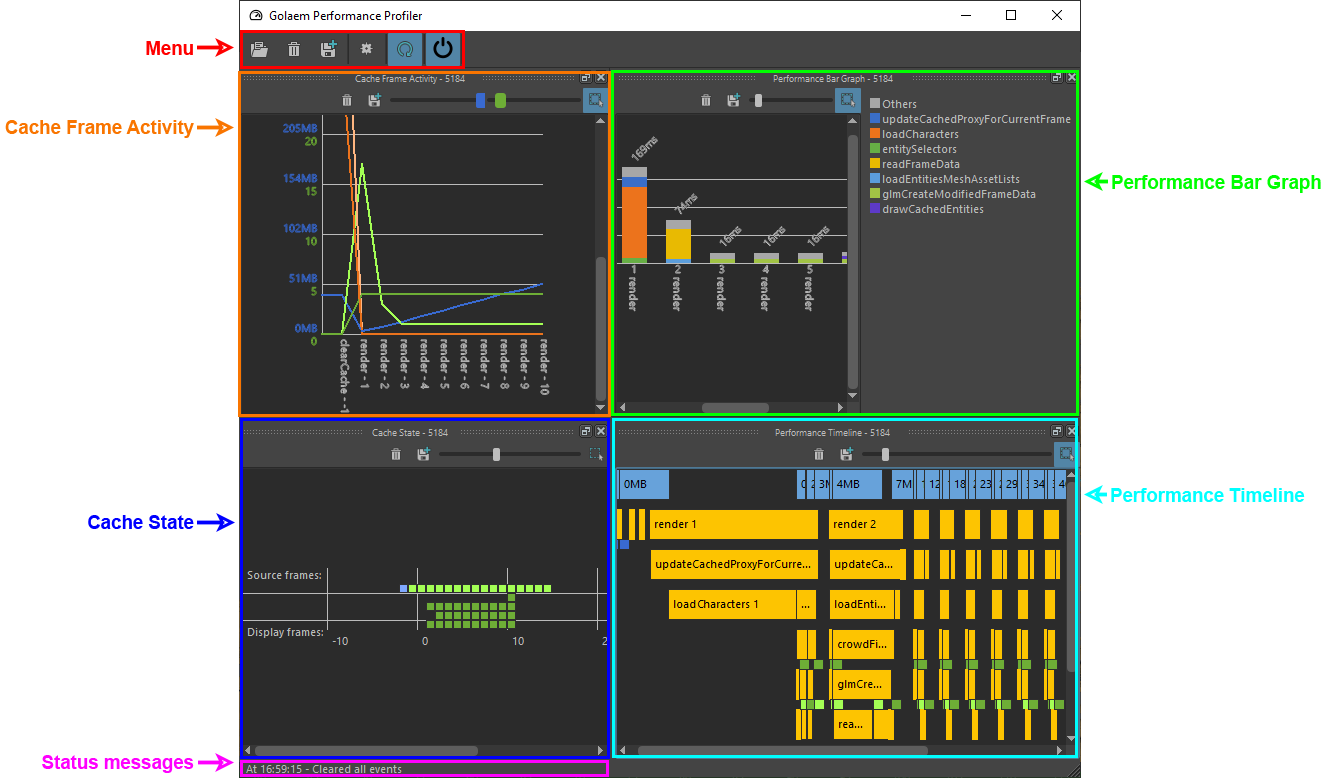
Menu
 |
Open a Golaem Performance Events file (.gpe) |
 |
Clear all data |
 |
Save a Golaem Performance Events file (.gpe) |
 |
Open the configuration panel |
 |
Enable or disable the display refresh |
 |
Enable or disable collecting live performance events |
Status Messages
This line will display connection information.
Cache Frame Activity
Display the layout cache activity (loaded/destroyed frame).
See the detailled documentation.
Cache State
Display the layout cache occupation (frames currently in cache or not)
See the detailled documentation.
Performance Bar Graph
Display simplified information on where is the CPU time spent when displaying or rendering a cache proxy.
See the detailled documentation.
Performance Timeline
Display detailled information on where is the CPU time spent when displaying or rendering a cache proxy.
See the detailled documentation.