Run a risk model calculation from the Risk Setup tab.
View-only users can only see published risk models and their results, while full-access users can see both published and unpublished models.
View risk model results
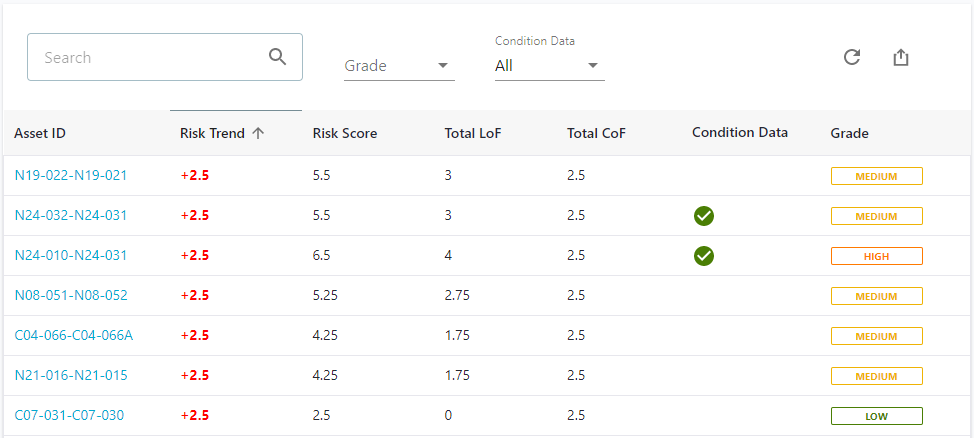
Once you have run the model's risk calculation, you can view the results on the Results page. Any errors and other messages related to the run can be seen on the Log page.
You can filter the results by Grade and/or Condition Data. You can also sort the results table by any of the columns.
You can export the results to CSV using the export button
 . If you apply filters to the results, only the filtered results will be exported.
View risk results on the network map
For published risk models that you have run the risk calculation for, the results can be seen on the network map.
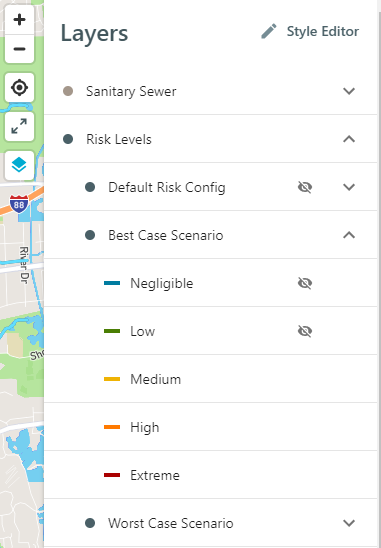
In the Layers panel
 under Risk Levels, you can see up to 10 risk models (in the order they were run) and choose which model and grades you want to see on the map. By default, the results from the latest risk model run are shown on the map.
View risk results for an asset
For a specific asset, you can see the risk results per model on the asset details page under Risk Details. This includes the scores and weighted scores for all of the individual LoF and CoF components, and a chart showing the risk trend over time.
You can also see a Risk Summary with the results from the latest runs.