Once an inspection has been approved and is correctly associated to the asset, scores and grades are calculated based on the inspection data and the MSCC standard grading method.
For each inspected asset you can see two sets of scores and grades: Structural and Service. You can see these within each Inspection on the Details tab, or you can see a table of all asset scores/grades on the Condition Summary tab. You can also see inspection grades on the map.
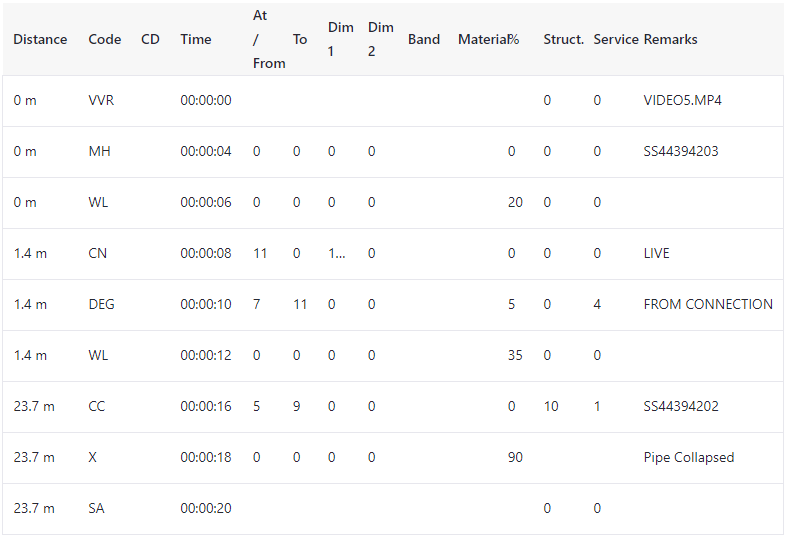
The scores and grades are calculated as explained in the tables below using the following inspection as an example.
Example Inspection


Score Calculations
| Rating | Description | Values for this example |
|---|---|---|
| Total | Sum of all the defect scores. |
Structural: 10 |
|
Service: 4 + 1 = 5 |
||
| Mean | The total score divided by the length of the surveyed pipe. |
Structural: 10 ÷ 23.7 = 0.42 |
|
Service: 5 ÷ 23.7 = 0.21 |
||
| Peak | The highest defect score. |
Structural: 10 |
|
Service: 4 |
||
| Quick | A shorthand way of expressing the number of occurrences for the two highest severity grades.
Defect scores are assigned a defect grade using the threshold values in the Final Grade table below. The four characters represent:
Note: This rating is not part of the MSCC standard, but is a helpful shorthand borrowed from the NASSCO PACP standard.
|
Structural: 2100 (The one structural defect score of 10 gets a defect grade of 2) |
|
Service: 3121 |
Grade Calculations
The final grades assigned to a pipe are based on the thresholds in the following tables.
Structural
The pipe's final structural grade is assigned based on the pipe's peak structural score.
| Grade | Peak Structural Score |
|---|---|
| 1 | <10 |
| 2 | 10 - 39 |
| 3 | 40 - 79 |
| 4 | 80 - 164 |
| 5 | 165+ |
In our example, the peak structural score is 10, so the final structural grade is 2.
Service
Both a peak service grade and a mean service grade are assigned based on the pipe's scores. The final service grade is the worst of these two values.
| Grade | Peak Service Score | Mean Service Score |
|---|---|---|
| 1 | <1 | <0.5 |
| 2 | 1 - 1.9 | 0.5 - 0.9 |
| 3 | 2 - 4.9 | 1 - 2.4 |
| 4 | 5 - 9.9 | 2.5 - 4.9 |
| 5 | 10+ | 5+ |
In our example, we have:
- A peak score of 4 = Peak grade of 3
- A mean score of 0.21 = Mean grade of 1
So, the final service grade is 3.