Once an inspection has been approved and is correctly associated to the asset, scores and grades are calculated based on the inspection data and the WSA standard grading method.
Each asset is classified by system type (sewer or stormwater) and material (rigid, flexible, or masonry) and defect scores are calculated accordingly.
For each inspected asset you can see two sets of scores and grades: Structural and Service. You can see these within each Inspection on the Details tab, or you can see a table of all asset scores/grades on the Condition Summary tab. You can also see inspection grades on the map.
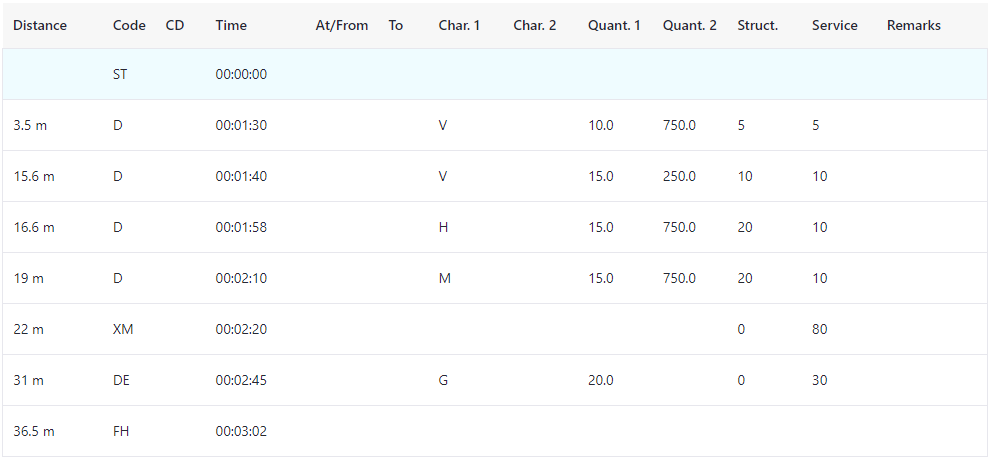
The scores and grades are calculated as explained in the tables below using the following inspection as an example.
Example Inspection


Score Calculations
| Rating | Description | Values for this example |
|---|---|---|
| Total | Sum of all the defect scores. |
Structural: 5 + 10 + 20 + 20 = 55 |
|
Service: 5 + 10 + 10 + 10 + 80 + 30 = 145 |
||
| Number | Number of defects with scores. |
Structural: 4 |
|
Service: 6 |
||
| Mean | The mean score is the total of all defect scores divided by the conduit unit length. |
Structural: 55 ÷ 36.5 = 1.51 |
|
Service: 145 ÷ 36.5 = 3.97 |
||
| Peak | The maximum of the summed scores for all defects that occur within a one-metre division of the sewer. |
Structural: 20 |
|
Service: 80 |
||
| Average | Total score divided by the number of defects with scores. |
Structural: 55 ÷ 4 = 13.75 |
|
Service: 145 ÷ 6 = 24.17 |
Grade Calculations
The final grades assigned to an asset are based on the thresholds in the following tables.
Structural
Both a peak structural grade and a mean structural grade are assigned based on the asset's scores. The final structural grade is the worst of these two values.
| Grade | Peak Structural Score | Mean Structural Score |
|---|---|---|
| 1 |
≤5 |
0 to ≤1.0 |
| 2 |
>5 to ≤15 |
>1.0 to ≤3.0 |
| 3 |
>15 to ≤40 |
>3.0 to ≤5.0 |
| 4 |
>40 to ≤60 |
>5.0 to ≤10.0 |
| 5 |
>60 |
>10.0 |
In our example, we have:
- A peak score of 20 = Peak grade of 3
- A mean score of 1.51 = Mean grade of 2
So, the final service grade is 3.
Service
Both a peak service grade and a mean service grade are assigned based on the asset's scores. The final service grade is the worst of these two values.
| Grade | Peak Service Score | Mean Service Score |
|---|---|---|
| 1 | ≤5 | 0 to ≤1.0 |
| 2 | >5 to ≤10 | >1.0 to ≤3.0 |
| 3 | >10 to ≤40 | >3.0 to ≤5.0 |
| 4 | >40 to ≤60 | >5.0 to ≤10.0 |
| 5 | >60 | >10.0 |
In our example, we have:
- A peak score of 80 = Peak grade of 5
- A mean score of 3.97 = Mean grade of 3
So, the final service grade is 5.