June 26 | Gain confidence in your analysis by learning how to interpret deterioration model results.
We've enhanced the deterioration modeling experience to help you analyze results with confidence. Learn how to interpret key metrics, understand where the data comes from, and discover what each prediction means so you can make more informed asset management decisions.
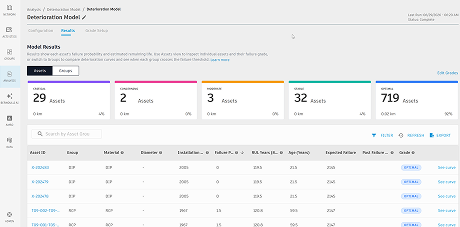
Deterioration Model results comes with the reasoning behind it.
Open any asset to view its failure-probability curve. The chart shows the survival curve for the asset group, with the selected asset plotted on the curve. You can quickly see where the asset is today, how its risk changes over time, and when it is projected to cross the 80% failure threshold.
Each asset view includes:
-
The asset located on its asset group curve, with its current age and failure probability marked on the chart.
-
A projection that shows how risk increases with age, compared with the 80% threshold line.
-
A plain-language summary, such as: "This asset is 87 years old with a 22% failure probability. It will reach the 80% failure threshold in approximately 44 years."
This helps you understand how Failure Probability and Remaining Useful Life values are derived. You can review the chart, understand the calculation, and confidently explain the decision it supports to your team, leadership, and stakeholders.
For more details, see Deterioration Modeling.