Analyzes how much variation from the mean exists.
Standard deviation helps determine if data are closely aligned or not. A low standard deviation indicates that the data points are closer to the mean, while a high standard deviation indicates that the data points are spread out over a larger range of values.
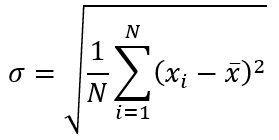
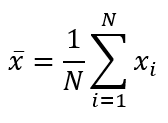
Standard deviation is equal to the square root of the variance. The following equations are used, where xi from i=1 to N represents the sensor values, from the current value and back N periods.

where

Syntax
stddev(TimeSeries, Period)
| Parameter | Description |
|---|---|
| TimeSeries | A node with time series data. |
| Period | The number of data intervals considered in the function. |
Example expression
stddev(@PressureSensor, 24): If the interval is set to hourly, this expression gives the standard deviation for the previous 24 hours.
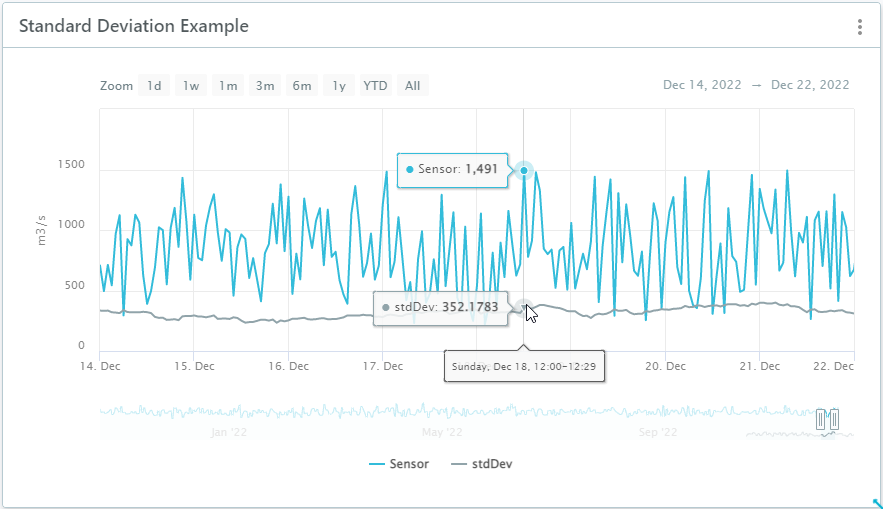
Example chart
