Create value mapping profiles to compensate for missing or anomalous data points in your raw sensor data.
You can set up rules to determine what to replace missing or anomalous data with: the last known value or a custom value.
This ensures that your data is of good enough quality to use in analytics, reports, etc.
For example, it is strongly recommended that you create a value mapping profile for Level and Tank Level sensors to map values to last known values. This will ensure that you have better results in your Mass Balance analyses.
Create a Value Mapping Profile
- Go to Admin
 Value Mapping and click Create Value Mapping.
- Give the profile a name.
- Select:
- A Sensor type: This profile will be applied to all sensors of this type, except for sensors that have their own specific value mapping profile configured (individual sensor value mapping profiles take precedence over sensor type profiles).
- And/Or, Individual sensors: This profile will be applied to these specific sensors.
- Select a rule for when the value is missing: replace with last known value or with a custom value.
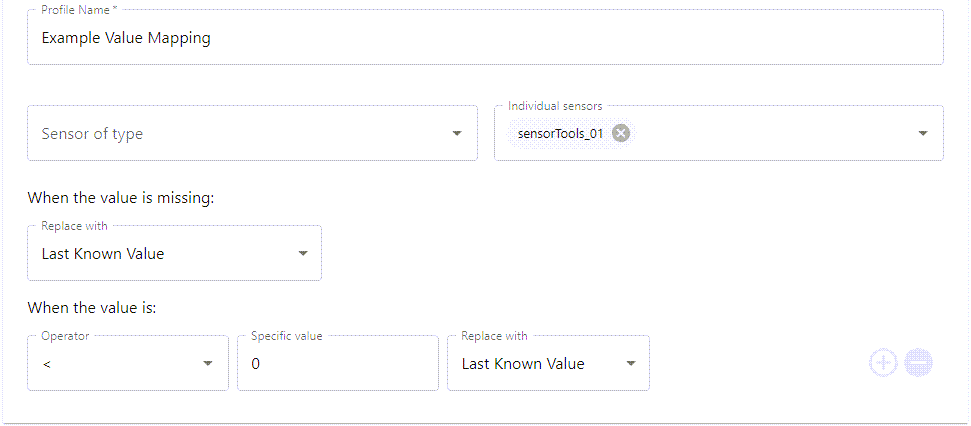
- Configure one or more additional rules to replace anomalous data. For the example value mapping below, the configuration would be:

You can remove this rule (using the minus button) if you only want to replace missing values.
- Click Save.
Example value mapping
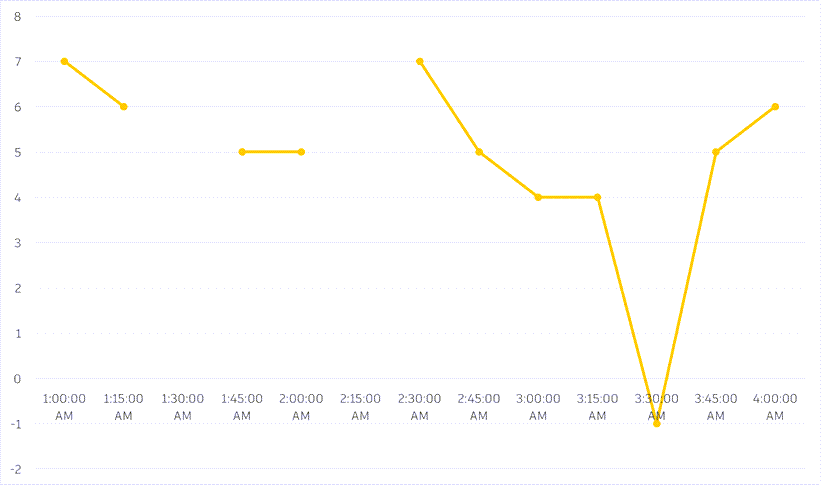
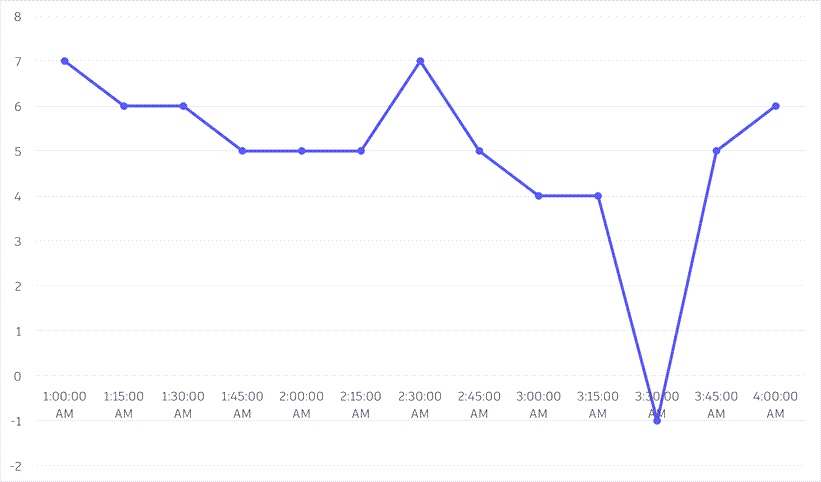
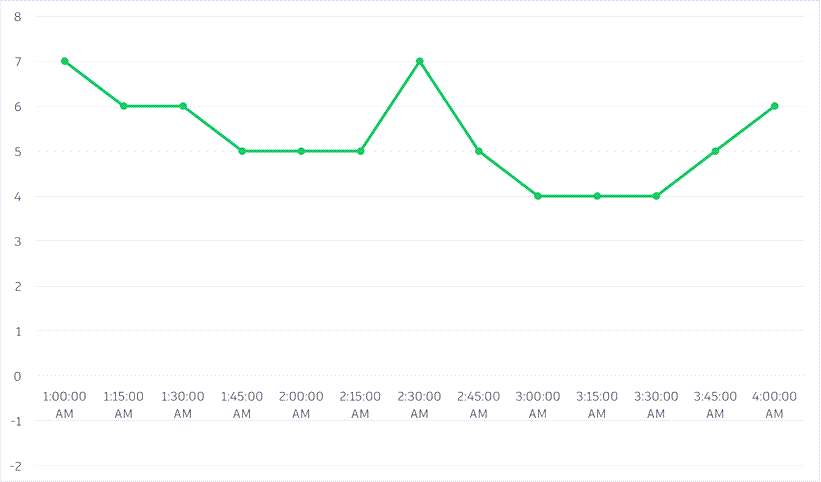
In the example below, we have a sensor whose data is read every 15 minutes (the sensor's interval is set at 900 seconds). In the raw data series, there are several missing data points and one anomalous reading (-1). Using a value mapping profile we can clean the incoming data to address the missing and bad values.
| Raw sensor data | Missing values replaced with last known value | Anomalous values replaced with last known value | |
|---|---|---|---|
| 1:00:00 AM | 7 | 7 | 7 |
| 1:15:00 AM | 6 | 6 | 6 |
| 1:30:00 AM | 6 | 6 | |
| 1:45:00 AM | 5 | 5 | 5 |
| 2:00:00 AM | 5 | 5 | 5 |
| 2:15:00 AM | 5 | 5 | |
| 2:30:00 AM | 7 | 7 | 7 |
| 2:45:00 AM | 5 | 5 | 5 |
| 3:00:00 AM | 4 | 4 | 4 |
| 3:15:00 AM | 4 | 4 | 4 |
| 3:30:00 AM | -1 | -1 | 4 |
| 3:45:00 AM | 5 | 5 | 5 |
| 4:00:00 AM | 6 | 6 | 6 |
Raw sensor data

Missing values replaced with last known value

Anomalous values replaced with last known value
