| File/s needed: |
| Click to download the Introductory [US units] tutorial model files. |
Summary Results
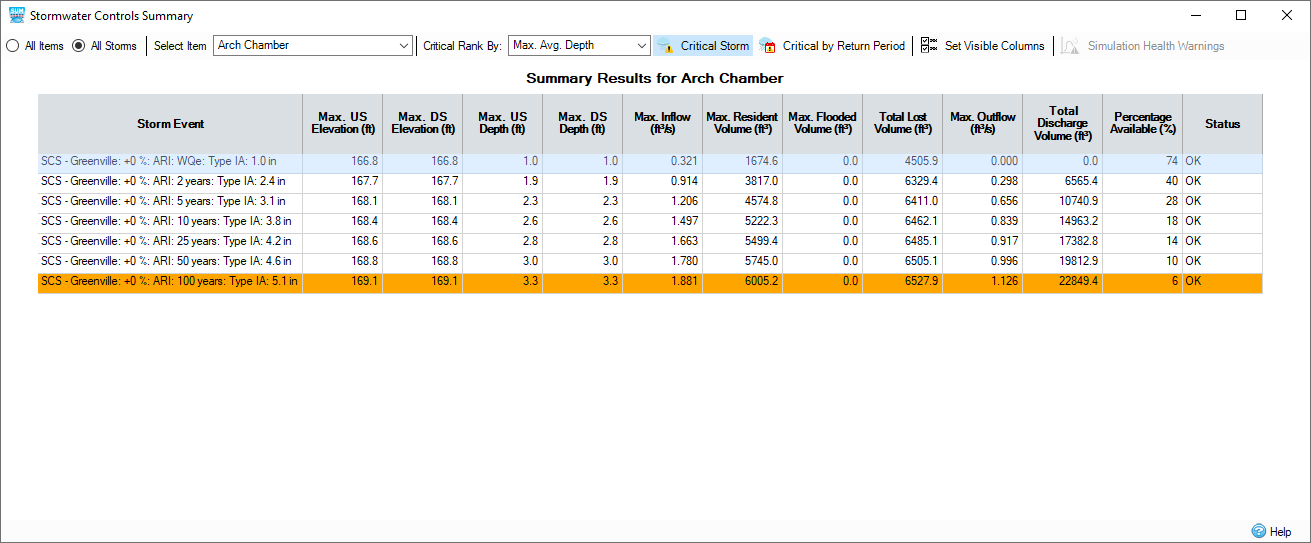
Whenever a stormwater system is analyzed the SWC Summary result table is shown. This will list a range of important information regarding how well the individual system elements performed, if they flooded and what volume capacity remains at critical inundation conditions.
Continue working on your model or open ID_US_Introduction_Project_Ch3.iddx. On the Analysis ribbon, select Go to run analysis on the model.
When viewing the SWC Summary result, select All Storms and Critical Storm options to view results for all rainfall for the Arch Chamber SWC and the orange highlighted storm representing the critical (i.e. highest water Elevation) event.

The Status is OK so we can investigate the elevations further. Looking at the combination of the Profile (Results ribbon > Show Profile > Flow Path), Arch Chamber SWC dimensions and the Summary Results, it can be seen that the chambers themselves are exceeded by the runoff volume, though due to the incorporation of the Embedded storage the facility is able to detain enough addition runoff volume to keep from over topping. Select the upper right X buttons to close any dialogs that are open.

Open the Connection Summary results under the Results ribbon and select Critical Storm to see how the pipe network performed.


The 100 year ARI storm is the highest intensity rainfall event so it is no surprise that the same storm is the critical event for most of the pipe network. However, note that a connection will be highlighted in Red if the Flow/Capacity relationship is greater than 1.0 - this would indicate a potentially undersized pipe. Flow/Capacity is the max flow calculated during the analysis divided by the ‘pipe full flow Manning's equation’. When this value is over 1, or even over 0.8, it is often an indication that this connection would benefit from being upsized. As the (likely conservative) Rational based Pipe Sizing was performed no segment of the network has a Flow/Capacity greater than 1.0. Close this dialog to continue reviewing other results.
Detailed Individual Results
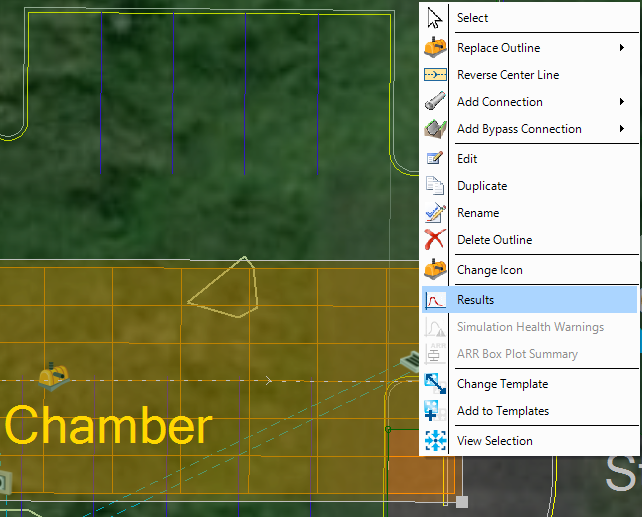
Either right-click the Arch Chamber SWC and select Results or select Stormwater Controls under the Results ribbon to view detailed results for the Chamber structure.


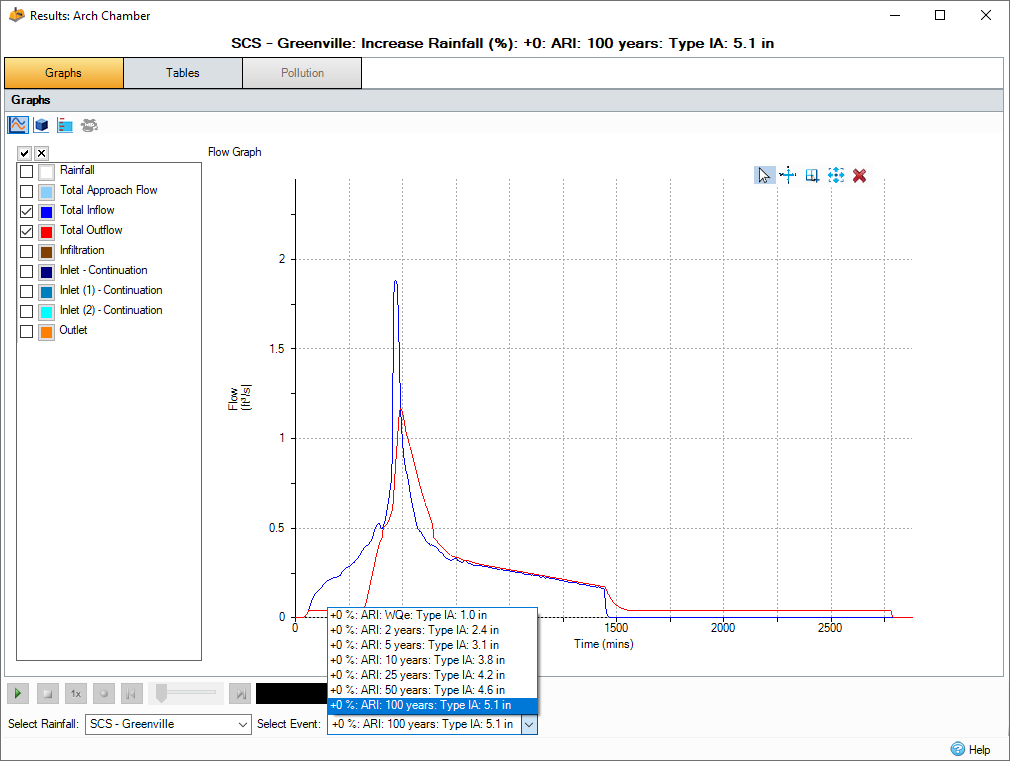
Switch the Storm Selection to the 100 year ARI event and uncheck the Graph types and options so just the Flow Graph is selected, with Total Inflow and Total Outflow checked. Using either the zoom controls or the mouse wheel, zoom into the graph to review the peak flow portion of the graph. This graphical view clearly shows the flow mitigation that results from the use of the Chamber structure.

Profile - Flow Path
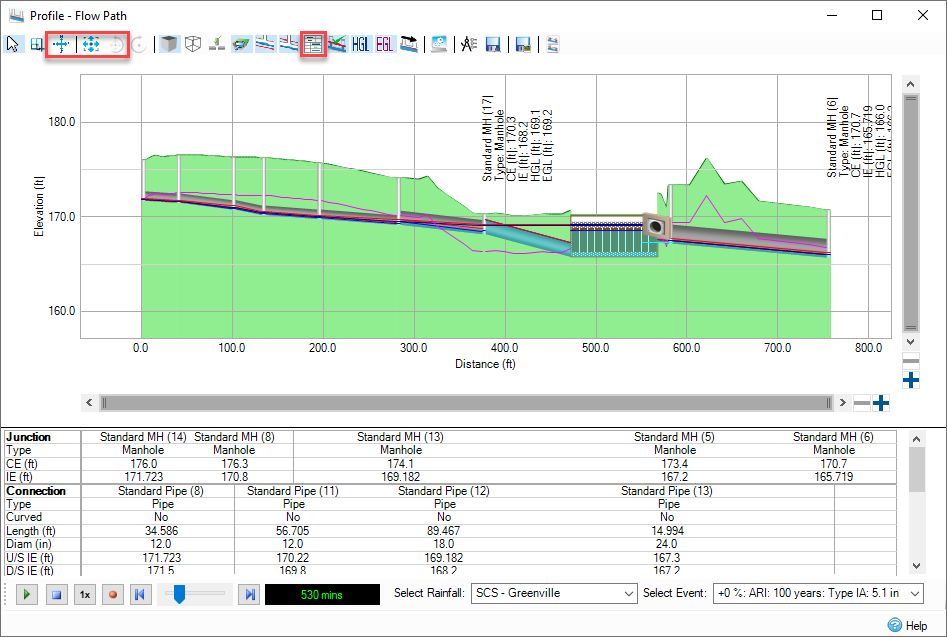
View a Profile of the Flow Path either by using the Tree View or the Results ribbon, Profiles option.


Using the animation display controls, play through the hydraulic analysis – zoom into the Profile using the zoom controls or the mouse wheel to review different section of the network. Close the Profile when done reviewing the Flow Path performance. To turn off the Summary Table below the profile select the Summary Table icon toggle on the top of the Profile dialog (see arrow in image below).
