| File/s needed: |
| Click to download the METRIC tutorial model files. |
The network needs to be assessed for exceedance flows to check if there is risk to property or people during an extreme event.
- Continue with your previous file or open Pond Design.iddx.
- Save the file as Exceedance Flows.iddx.
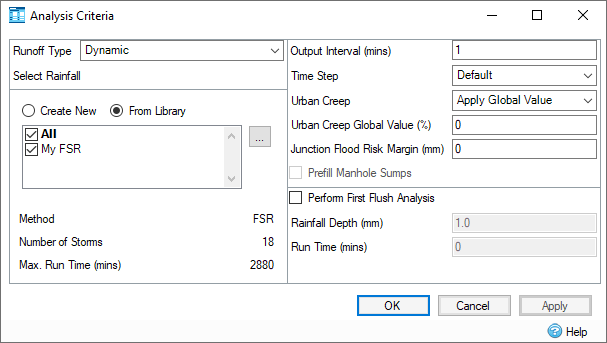
- Open the Analysis Criteria from the Analysis ribbon and click the … button to open the Rainfall.
- Click
Return Periods, uncheck the 30 year return period and ensure that the 100 year plus 20% climate change option is selected.

- Click OK, then click Go to run the analysis. This is to identify the worst-case storm for flooding to assess using 1D -2D analysis. Since 1D-2D Analysis is computationally heavy, we will just be running one storm. You can find out more in the 1D - 2D Analysis Help topic.
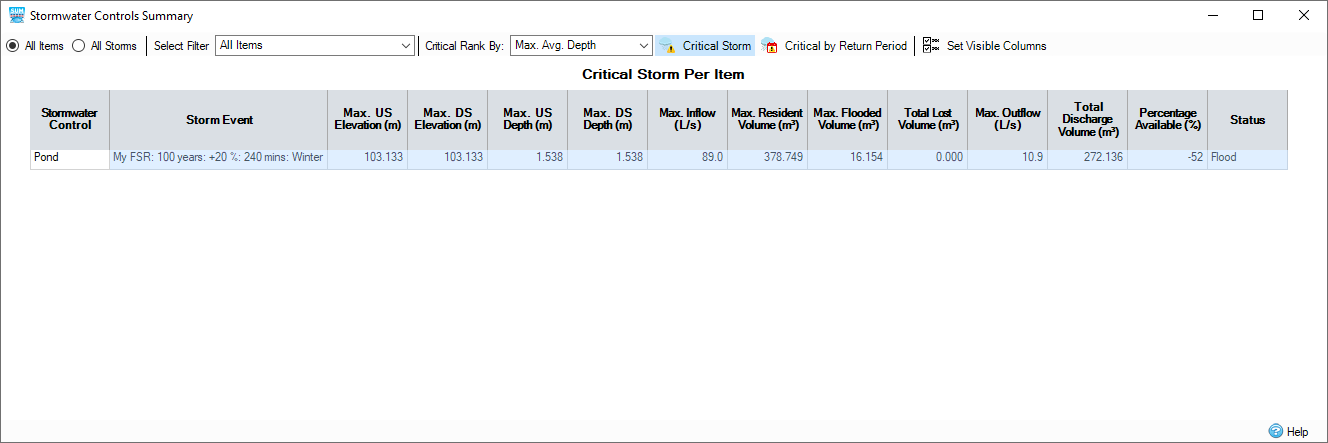
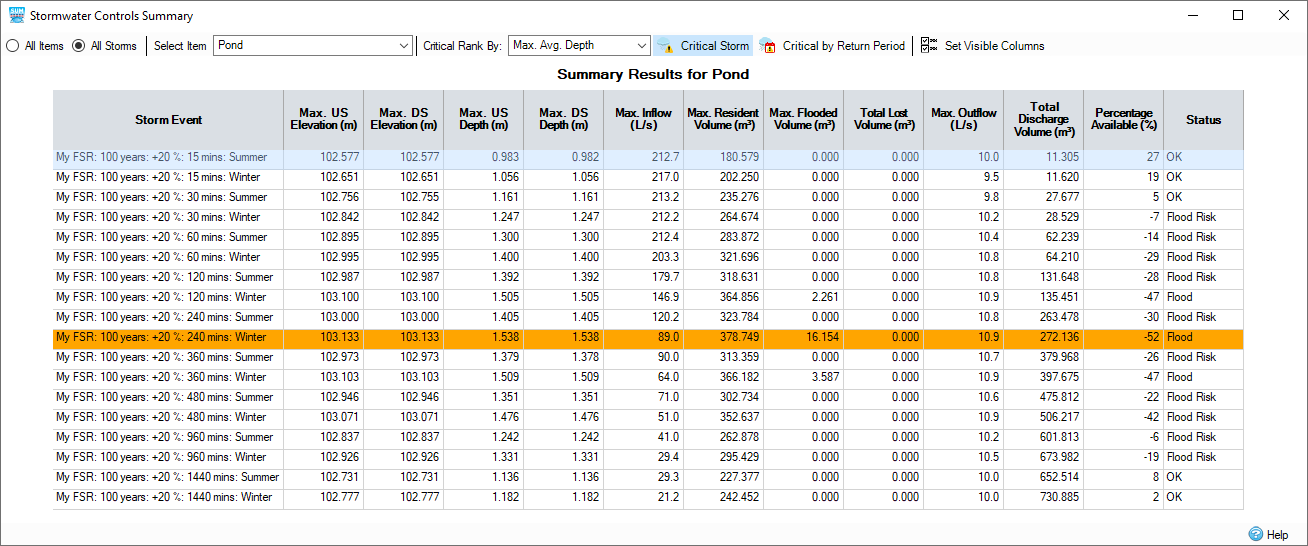
- When the results appear, click the Critical Storm button on the Stormwater Controls Summary. We can see the worst case storm is the 240 minute Winter storm which floods. The All Storms selection also shows us that Flooding occurs for several storms.
- Open the Junctions Summary and click the Critical Storm button and we can see that the 15 minute Winter storm is also flooding at the top end of the network. We will run this storm in this exercise but both should be checked.

- If you started this tutorial using
Pond Design.iddx, then you need to load the surface data for deluge assessment before running the analysis for 1D-2D. Note that if surface data has been loaded, then you do not need to perform this step.
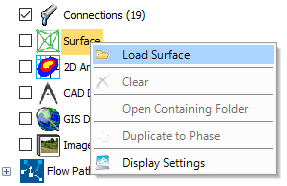
- Right-click the
Surface
layer from the Tree View and select
Load Surface.
- In the
Surface Data
dialog, select
Load From.

- Locate Deluge Assessment_Phase.idsx and then click Open.
- Click OK.
- In the message, select Update All - All elevations will be updated.
- Right-click the
Surface
layer from the Tree View and select
Load Surface.
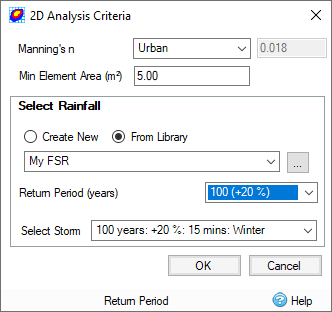
- From the Analysis ribbon select the 1D – 2D Analysis Go button to see the 2D Analysis Criteria. Since the site is largely residential, we will keep the Urban setting for Manning’s n. Enter 5 m2 for the Min Element Area – this determines how small the mesh, which is formed from triangles, is and therefore how accurate the analysis. It also greatly affects the speed of the analysis. Finally, select the My FSR rainfall and the 100 year +20% : 15 mins: Winter storm to run.
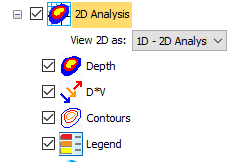
- On the Tree View, check the option and expand the 2D Analysis settings.
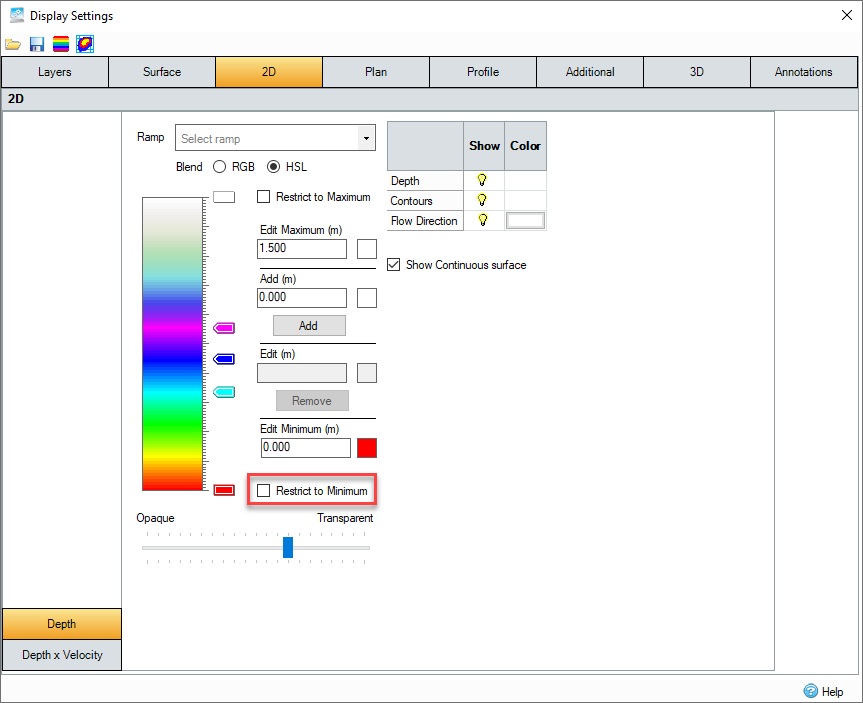
- Right-click and select Display Settings. Select the 2D tab and uncheck the Restrict to Minimum option turned on when we ran Deluge earlier.
Note: If you started this tutorial using Pond Design.iddx, then the Restrict to Minimum option is already unchecked.
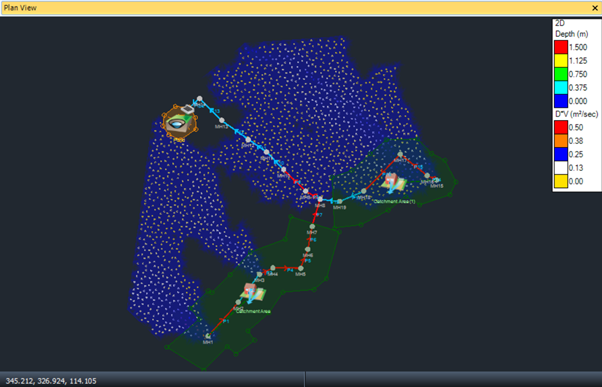
- Viewing the flooding can be seen to flood from several manholes and flow down the hill away from the road. However, it impacts at least one property and additional measures would need to be considered if further properties were placed next to the road.
Note: To see this display, turn off the Surface layer in the tree view.
- 2D results can also be exported to GIS shape files via the Export ribbon and can be included in Transmit Design.