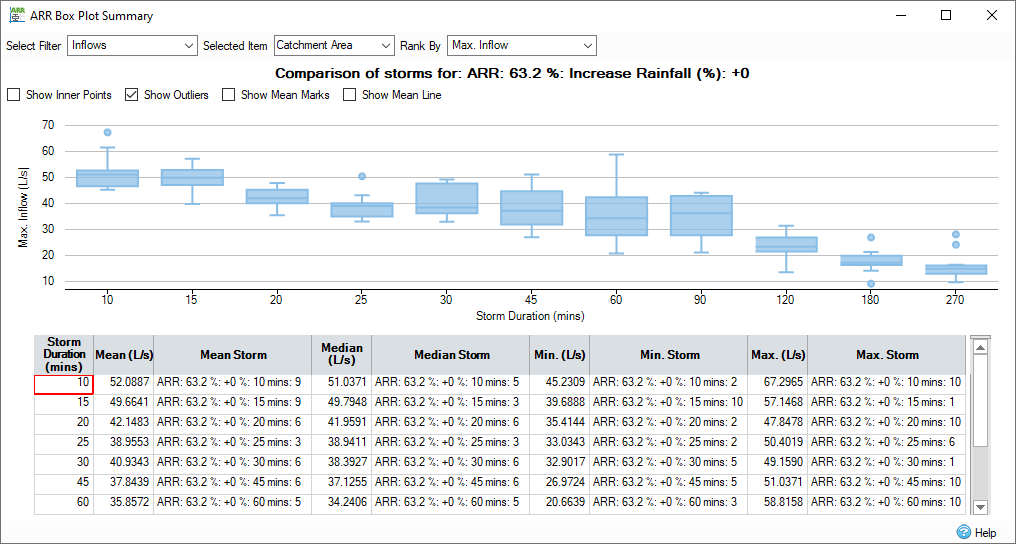
The ARR Box Plot Summary shows a summary of results for a selected item (Inflow, Junction, Stormwater Control or Connection) of all the storm duration for a selected AEP/Increase Rainfall Set via Storm Selector.
This form is only available for results that have been generated using ARR Rainfall and will close for all other types of rainfall, dry weather flow phases, and 2D events.

Filtering the Results
Results can be viewed for an item on the using the Filter option to narrow the Item listing to either Inflows, Junctions, Stormwater Controls or Connections.
The Rank By drop-down allows the selection of a specific property in the summary that will determine which of the 10 temporal patterns for the selected AEP/Increase Rainfall/Storm Duration set has the value which is the first temporal pattern above the mean (average) over the 10 results for the given property.
Box Plot
Provides a graph showing the results for the given item and selected property.
Show Inner Points - Shows all the data points inside the box plot.
Show Outliers - Shows any outlier data points.
Show Mean Marks - Shows the mean of the data set (excluding outliers).
Show Mean Line - Shows a line connecting all the means for every box.
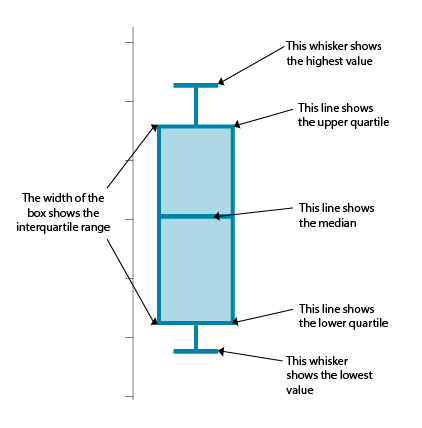
A box and whisker plot is a graph that displays information about the range, median, and quartiles. This plot can easily demonstrate whether a distribution is skewed and whether there are potential outliers in the data set, especially for a large number of observations. Box and whisker plots are optimal for comparing distributions because the center, spread, and overall range are immediately visible. Normally, it is represented alongside a number line, similar to the following:

A box and whisker plot is used to summarize a set of data measured on an interval scale. This method is often employed in explanatory data analysis.
In a box and whisker plot:
- The end lines represent the upper and lower quartiles, so the box spans the interquartile range.
- The blue line inside the box represent the median.
- The two lines outside the box represent the whiskers, which extend to the highest and lowest observations.
Summary Table
For each storm duration for a given AEP/Increase Rainfall pair the mean value, median value, min value and max value is reported.
Mean Storm - Displays the temporal pattern which is the first value above the mean.
Median Storm - Displays the temporal pattern which is used to calculate the median. For an even number of temporal patterns the median is calculated by ordering the values in ascending order and taking values at point 5 and 6 and finding the average. The temporal pattern reported is the one at point six.
Min Storm - Displays the temporal pattern with the lowest value.
Max Storm - Displays the temporal pattern with the highest value.