The Rational Method (and its variants) bases its calculations on Rainfall Data in the form of Intensity, Duration and Frequency (IDF) data.
IDF files are created on the principle that for a given Return Period (or Frequency) and a set duration, a storm will have a known average intensity. For example a storm near Seattle in the USA with return period of 5 years (frequency), and a duration of 20 minutes has an average intensity of 17.5 mm/hr.
The IDF file represents a single frequency and is a sequential list of average intensities for different durations of storm. In the Rational Method, each pipe or channel is designed for the average intensity of storm of a duration equal to its time of concentration. It could be said, therefore, that each pipe or channel in a network is designed for a different storm, as each pipe has a unique time of concentration.
The Rational Method is therefore not suitable for backwater analysis, or any analysis that involves the effect of one continuous storm, as no two pipes are designed using the same storm. A full analysis of the system should be used to determine the real hydraulic grade lines, which will vary minute by minute throughout a storm.
IDF data can be stored in the rainfall manager database for a single return period (Single RP IDF) or for multiple return periods (Table IDF). The rainfall manager shows these under distinct sub branches of the IDF branch.
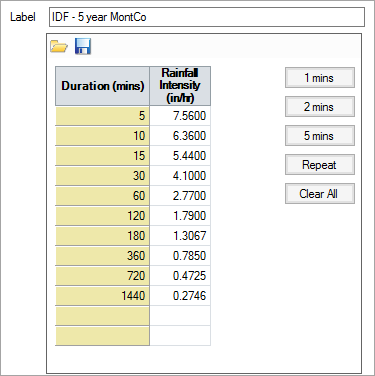
Single RP IDF

Toolbar
New
Allows a new IDF record to be created.
Load
Allows an IDF record to be loaded from file. These include:
-
IDF File (.ididfx) - The InfoDrainage file format for IDF records.
-
Text File (.csv,.txt) - Allows IDF data to be loaded from comma seperate files via the Universal Importer.
-
Excel File (.xls,.xlsx) - Allows IDF data to be loaded from Microsoft Excel format.
Save
Save the current rainfall event to a .ididfx file so it can be reused elsewhere.
Label
This is the label given to the IDF data that is then shown on the Design Criteria form. It can be used to give the IDF data a suitable label. i.e. 5 year return period.
Spreadsheet
Duration
The duration that (average) intensity applies to.
Intensity
The average intensity for the duration at the given return period (ARI).
Buttons
1, 2 & 5 mins
Creates a set of 100 entries at the specified interval ready for data to be entered.
Repeat
Repeats the currently selected Intensity value down the spreadsheet.
Clear All
Clears ALL of the information in the spreadsheet
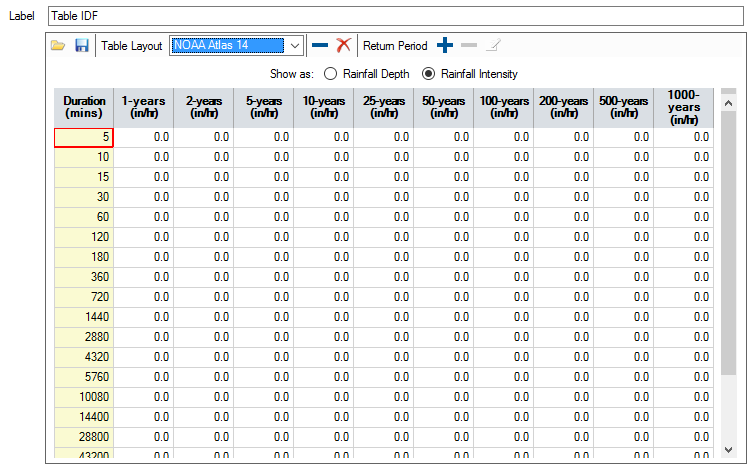
Table IDF

Toolbar
Open
Allows an IDF table to be loaded from file. These include:
-
Table IDF File (.ididtx) - The InfoDrainage file format for IDF Tables.
-
NOAA Atlas 14 Point Precipitation Frequency Estimates (.csv).
(These files can be created at NOAA's National Weather Service website)
Save
Save the current rainfall event to a .ididtx file so it can be reused elsewhere.
Table Layout
Select a predefined layout for the spreadsheet. Currently supported layouts are NOAA Atlas 14, KOSTRA 2000 and KOSTRA 2010.
Delete Row
Delete the currently selected row in the spreadsheet.
Clear All
Clears ALL of the information in the spreadsheet.
Add Return Period
Add a new return period column to the spreadsheet.
Delete Return Period
Remove the current return period column from the spreadsheet.
Edit Return Period
Modify the return period of the currently selected column.
Label
This is the label given to the IDF data that is then shown on the Design Criteria form. It can be used to give the IDF data a suitable label. i.e. 5 year return period.
Show As
The data in the spreadsheet can be shown as rainfall depth or intensity.
Spreadsheet
Duration
The duration that (average) intensity applies to.
Intensity/Depth
All other columns are the average intensity or depth for the duration at the given return period (ARI). The return period is shown in the column title.