Storage varies with different configurations of controls and Stormwater Controls (SWC). InfoDrainage will look at two extreme cases to provide an estimate of the range of storage required for the site. This estimate may be used as a starting point for detailed design but it must never be used as a final design as the variables it assumes are significant. In certain circumstances, it is also possible to achieve a final design outside the range shown.
Input
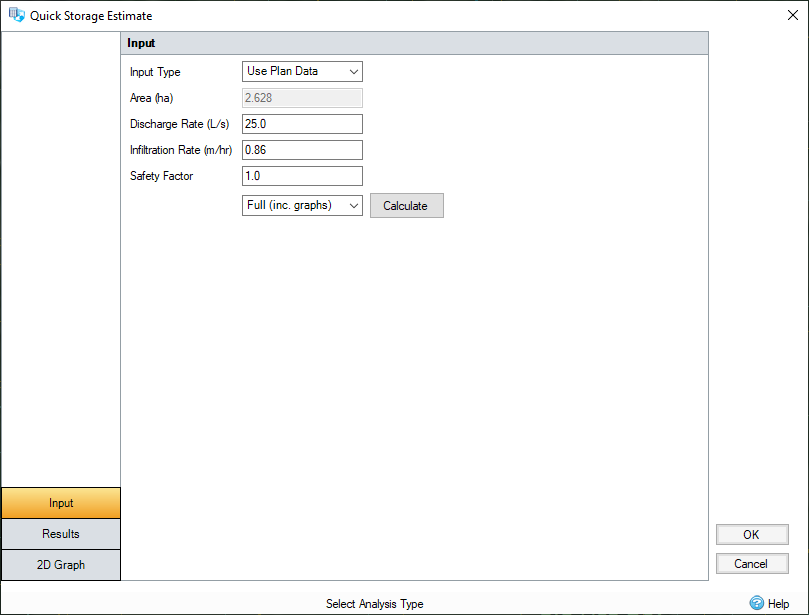
This form allows you to input all the required fields for making the calculation.

Input Type
- Use Plan Data
- When this option is selected, the inflows already specified on the design will be used and the Rainfall setup in the Analysis Criteria will be used together with the Runoff Coefficient. In addition to inflow areas, the calculation will also total the flows from any Input Hydrographs so these are also considered as part of the storage calculation. Please note that each Input Hydrograph is capped to the length of the analysis run for the current event. i.e. twice the storm duration. Depending on how the form is accessed the contributing inflows will vary:
- Global Sizing Mode - When the form is accessed from the Preliminary Sizing Ribbon directly it will consider all Inflows.
- Individual Stormwater Control Mode - When the form is accessed from the Stormwater Control Sizing Calculator, only the inflows being drained by that SWC will be considered. This allows the volume required by that single stormwater control to be determined and then used to size it in isolation.
- User Input - When this option is selected the specified area will be used as well as the selected rainfall.
Area - This is the total impermeable (roof and paved) area in hectares.
Volumetric Runoff Coefficient (User Input Data only) - The proportion of rainfall falling on the catchment that enters the site as surface runoff.
Discharge Rate - The maximum discharge required from the Site.
Infiltration Rate - If set to 0, all outflow will be through traditional controls and will be limited by the Discharge Rate. If set to a non-zero value, this defines the infiltration rate from both sides and base of the structure. Any infiltration flow is in addition to the maximum allowable discharge from the control. If the Infiltration rate is set, the program will generate an Infiltration feasibility overlay for the results graphs.
Safety Factor - Reduces the infiltration rate during the analysis to account for silting up or poor maintenance. This is required for the UK.
Increase Rainfall (User Input Data only)- This will scale all rainfall by the amount specified. This can be used to take climate change, or other factors, into account. Input hydrograph flows are not scaled.
Rainfall Method (Use Plan Data only) - A set of rainfall options are available to choose from:
- Design Storms - A choice of a series of rainfall methodologies are available: ARR, SCS or User Defined. Depending on the selected option, the required variables are requested.
- Rainfall Records - A set of rainfall records can be entered or loaded from file. These could be from another synthetic rainfall methodology or even a real recorded event. Options to load from CSV, TXT and Excel formats are available for ease.
Quick/Full (inc. graphs) - Both these options produce the range of results with and without infiltration, however the Full option also produces the 2D graphs.
When all variables have been set as required, click Calculate to generate the results.
Results
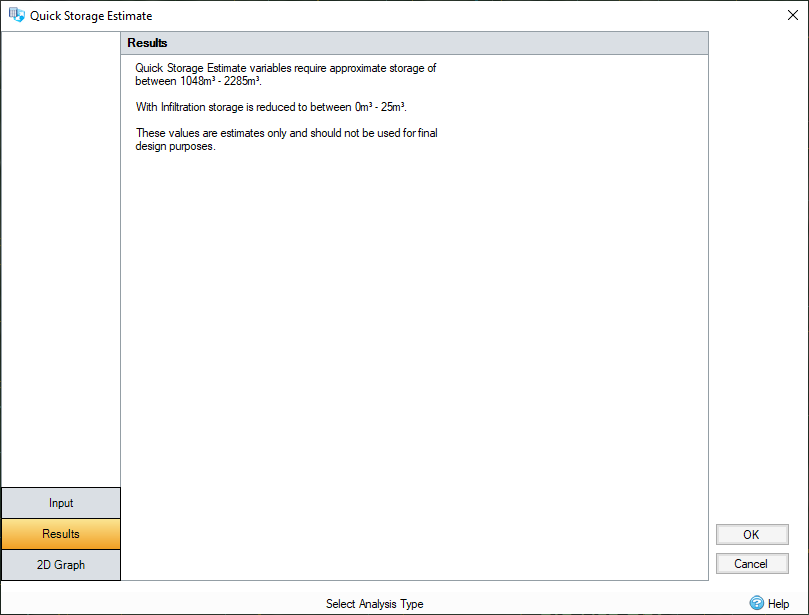
The program shows the upper and lower bounds of storage required for the variables given.
If the infiltration coefficient is set to a non-zero value, then a range of storage required will also be presented for an infiltration system.

2D Graphs
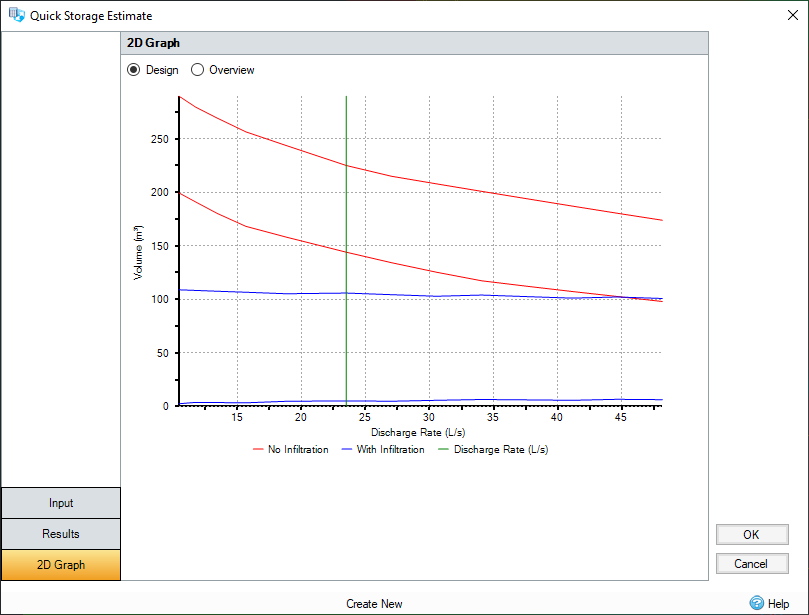
Another output of the Quick Storage Calculator is a 2D graph with Discharge Rate vs Volume of the computed result.

Design Graph
The Design graph shows the effects on storage requirements of varying the maximum discharge rate. The minimum and maximum storage is shown in purple. The green vertical line shows the specified maximum allowable discharge rate. If the infiltration coefficient is set to a non-zero value, then maximum and minimum storage requirements of an infiltration system are overlaid in blue.
Overview Graph
The Overview graph shows the effects on storage requirements of varying the maximum discharge rate. A much larger range of discharge values are shown than the Design graph. The minimum and maximum storage is shown in purple. The green vertical line shows the specified maximum allowable discharge rate. If the infiltration coefficient was set to a non-zero value, then maximum and minimum storage requirements of an infiltration system are overlaid in blue