The UK and Ireland Region Picker allows you to select a specific region on the map and the corresponding data will be automatically populated.
England, Wales and Scotland
The map shows region numbers of the catchment based on FSR Figure I.2.4, which is used to calculate the different return periods as described below.

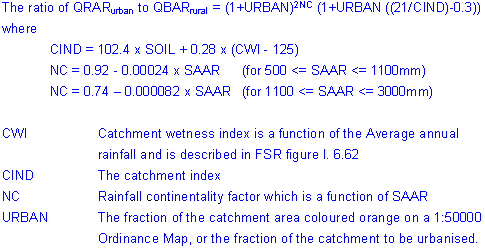
QBAR rural - Calculated using the following formula (equation yields m³/s):

QBAR urban, Adjustment for urbanization - Calculated from IH report 124 equations 7.2 to 7.4. CIRIA Book 14, 3.2.2 (equations yield m³/s).

Urbanized catchment growth factors for return periods not exceeding 50 years
CIRIA Book 14, 3.2.3
Calculate equivalent reduced variate y from the following table based on CIRIA Book 14 Table 3.1.
|
Urban |
Return Period (years) |
|||||
|
2 |
5 |
10 |
20 |
25 |
50 |
|
|
0.00 |
0.32 |
1.50 |
2.25 |
2.97 |
3.20 |
3.90 |
|
0.25 |
0.57 |
1.55 |
2.20 |
2.76 |
2.93 |
3.35 |
|
0.50 |
0.65 |
1.60 |
2.12 |
2.55 |
2.67 |
3.00 |
|
0.75 |
0.78 |
1.65 |
2.04 |
2.35 |
2.43 |
2.67 |
Using the y value from the above table, obtain the growth factor from the following table based on CIRIA Book 14 Table 3.2.
|
Region |
Values of y |
||||||||
|
0.0 |
0.5 |
1.0 |
1.5 |
2.0 |
2.5 |
3.0 |
3.5 |
4.0 |
|
|
1 |
0.82 |
0.94 |
1.06 |
1.20 |
1.36 |
1.53 |
1.72 |
1.94 |
2.17 |
|
2 |
0.84 |
0.94 |
1.05 |
1.18 |
1.33 |
1.51 |
1.72 |
1.95 |
2.23 |
|
3 |
0.84 |
0.98 |
1.11 |
1.25 |
1.38 |
1.52 |
1.65 |
1.79 |
1.92 |
|
4 |
0.80 |
0.93 |
1.07 |
1.23 |
1.40 |
1.58 |
1.79 |
2.01 |
2.25 |
|
5 |
0.79 |
0.93 |
1.10 |
1.29 |
1.52 |
1.79 |
2.11 |
2.49 |
2.93 |
|
6/7 |
0.77 |
0.92 |
1.09 |
1.28 |
1.50 |
1.74 |
2.02 |
2.34 |
2.69 |
|
8 |
0.78 |
0.92 |
1.07 |
1.23 |
1.40 |
1.58 |
1.76 |
1.95 |
2.16 |
|
9 |
0.84 |
0.96 |
1.08 |
1.21 |
1.35 |
1.49 |
1.64 |
1.80 |
1.97 |
|
10 |
0.85 |
0.96 |
1.07 |
1.19 |
1.31 |
1.45 |
1.58 |
1.73 |
1.88 |
Region is grouped into 10 regions for the determination of growth factors. FSR Figure I..2.4. and CIRIA Book 14, Figure 3.7.
Urbanized catchment growth factors for return periods exceeding 50 years
CIRIA Book 14 Table 3.2.4.
Find the rural and urban growth factors for the 50 year return period and compute their ratio G50.
Compute RMAF as the ratio of the rural and urban QBAR.

For the required return period t compute the ratio of the urban and rural growth factors from the following equation:

The rural growth factor is read from the following table based on CIRIA Book 14 table 3.3.
|
Region |
Return Period (years) |
||||
|
100 |
200 |
250 |
500 |
1000 |
|
|
1 |
2.48 |
2.81 |
2.92 |
3.25 |
3.63 |
|
2 |
2.63 |
2.98 |
3.10 |
3.45 |
3.85 |
|
3 |
2.08 |
2.36 |
2.45 |
2.73 |
3.04 |
|
4 |
2.57 |
3.02 |
3.17 |
3.62 |
4.16 |
|
5 |
3.56 |
4.19 |
4.39 |
5.02 |
5.76 |
|
6/7 |
3.19 |
3.75 |
3.93 |
4.49 |
5.16 |
|
8 |
2.42 |
2.85 |
2.98 |
3.41 |
3.91 |
|
9 |
2.18 |
2.47 |
2.57 |
2.86 |
3.19 |
|
10 |
2.08 |
2.36 |
2.45 |
2.73 |
3.04 |
Multiply the rural growth factor by Gt to yield the urban growth factor.
Finally the urban t year flood is the product of the urban growth factor and QBARurban.
Mean Annual Flood Data
Return periods and flows are produced for regions and return periods of 2 years to 1000 years as shown below.
Ireland
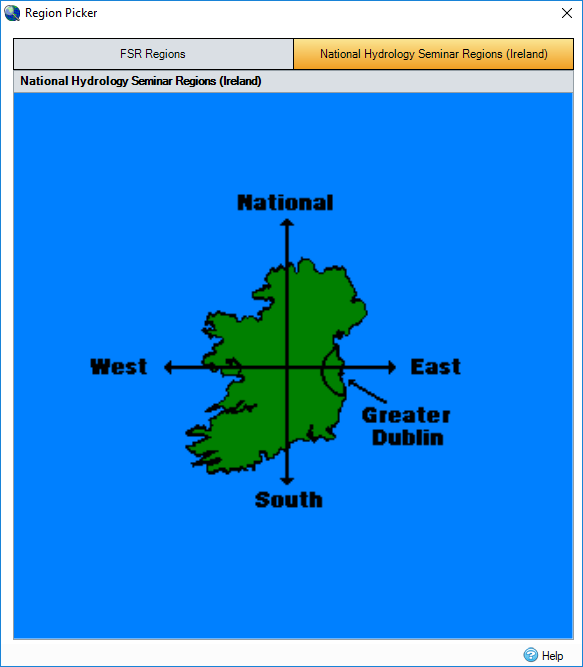
The map shows Region numbers of the catchment based from the National Hydrology Seminar, which are used to calculate the different return periods as described below.

Irish Growth Curves
The following growth curves are used for Ireland taken from the paper "Comment on Estimation of Greenfield Runoff Rates " - A.M.Crawley & C.Cunnane - National Hydrology Seminar 2003 (The one year value is take from the Greater Dublin Strategic Drainage Study, Volume 2.)
|
Region |
MD Region No |
Return Period (Years) |
|||||||
|
1 |
2 |
5 |
10 |
25 |
50 |
100 |
200 |
||
|
National (revised) |
11 |
0.85 |
0.96 |
1.20 |
1.35 |
1.55 |
1.70 |
1.84 |
1.99 |
|
Ireland East |
12 |
0.85 |
0.96 |
1.21 |
1.38 |
1.59 |
1.74 |
1.90 |
2.05 |
|
Ireland South |
13 |
0.85 |
0.96 |
1.19 |
1.35 |
1.55 |
1.70 |
1.84 |
1.99 |
|
Ireland West |
14 |
0.85 |
0.96 |
1.18 |
1.33 |
1.51 |
1.64 |
1.78 |
1.91 |
The following growth curve for the Greater Dublin region is defined below:
|
Region |
MD Region No |
Return Period (Years) |
|||||||
|
1 |
2 |
5 |
10 |
25 |
50 |
100 |
200 |
||
|
Greater Dublin |
15 |
0.85 |
0.92 |
1.37 |
1.67 |
2.05 |
2.33 |
2.61 |
2.89 |
The one year value is taken from the Greater Dublin Strategic Drainage Study, Volume 2. The remaining values are derived (to two decimal places) from "An Investigation of the Flood Studies Report ungauged catchment method for Mid-Eastern Ireland and Dublin ", Michael Bruen - Equation 7.