The Quick-Start tutorial is designed for first-time users of Water Quality (WQ) Calibrator and provides a guided tour to core commands and functions used to create and execute a calibration run in InfoWater Pro. The Quick Start tutorial will help first-time you become familiar with the core set of WQ Calibrator features and should be used as a launching point to a more comprehensive understanding of the program. The estimated time to complete the Quick Start tutorial is approximately 30 minutes. The Quick Start tutorial will help you become familiar with the following:
- Creating calibration data.
- Setting important simulation options.
- Making a calibration run.
- Reviewing and analyzing calibration results.
- Exporting calibration results.
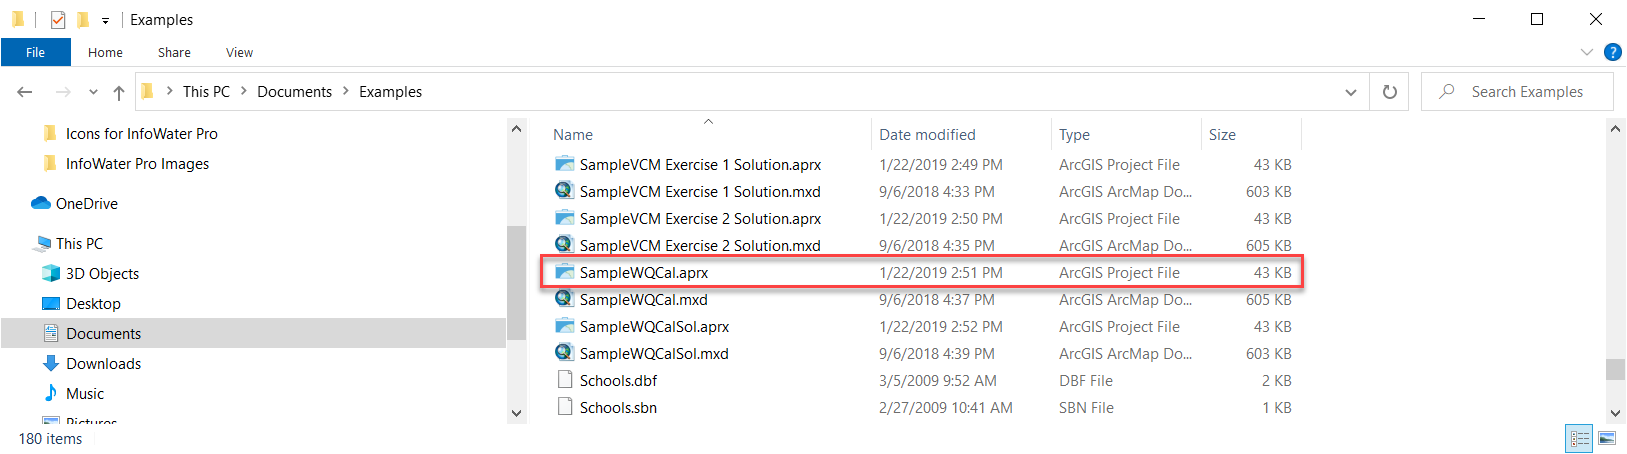
During the Quick Start tutorial, you will modify an existing project called “SampleWQCal”. This project can be downloaded from Quick Start Tutorial Example files.
 The
The
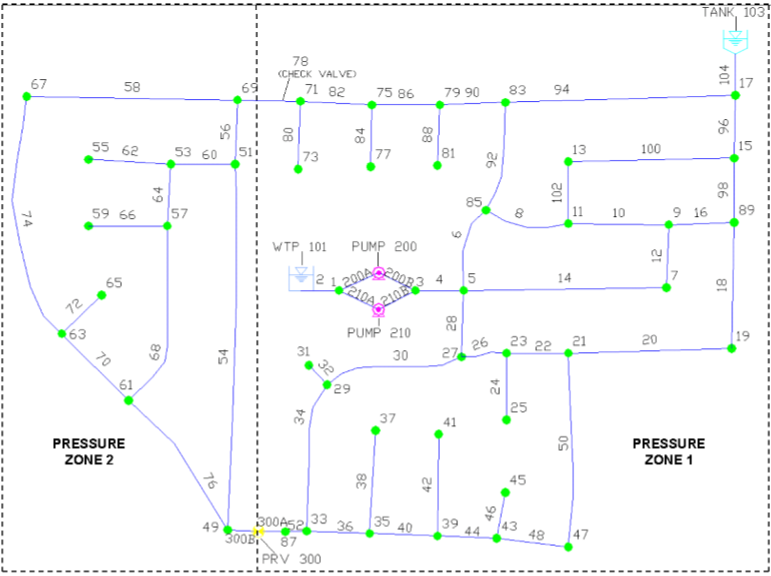
SampleWQCal project modified in this tutorial illustrates how WQ Calibrator calculates pipe wall coefficients to best match field conditions to model conditions. The SampleWQCal model schematic is shown below. The model contains two pressure zones and consists of the following components:
- One reservoir (storage node 101)
- One tank (storage node 103)
- Two pumps located at the water treatment plant and numbered 200 and 210
- One pressure reducing valve located at node 300
- One check valve located in pipe 78
- Fifty-eight pipes
- Forty-five junction nodes
- One reference file containing the parcel and street layout (not shown in the illustration below)
During the tutorial, you will be guided through:
- Creating pipe wall coefficient groups.
- Choosing calibration simulation options.
- Performing a calibration run.
- Exporting calibration results.
The first step is to load the SampleWQCal project.
- Choose the Start menu, select Programs, choose the InfoWater Pro program group, and then choose InfoWater Pro. ArcGIS Pro will now start.
- Choose
Open from the
File menu. On the Select File dialog box, navigate to the directory containing the SampleWQCal project. Open the SampleWQCal project.
Note: If you have not previously downloaded the Example files, you can do so from Quick Start Tutorial Example files.
- Click on the red down arrow icon at the left-hand side of the Command Center. When initialized, the icons on the Command Center will be enabled for use.
- Before continuing, save the “SampleWQCal” project to a new project. If you wish to restart the tutorial, the original project will be available. Choose the Save As command from the File menu. On the dialog box enter the new project name “Tutorial”. This becomes the active project.
Step 1: Launch WQ Calibrator
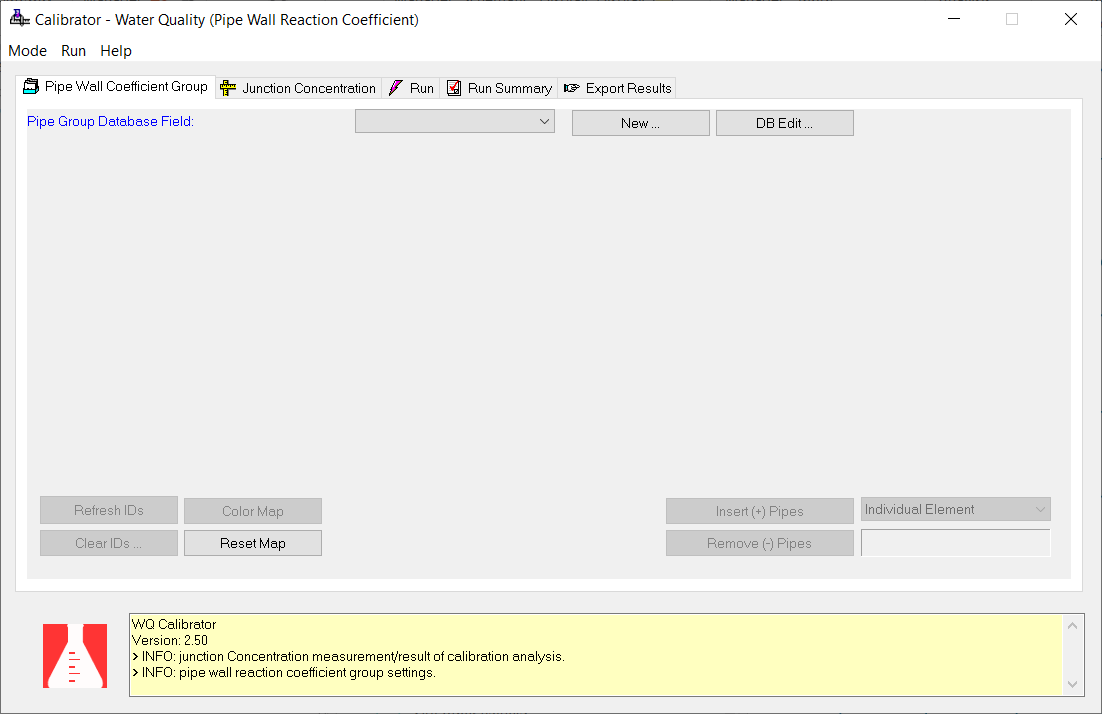
The first step is to launch WQ Calibrator dialog box.
- From the
InfoWater Pro ribbon, click on
Apps. With the Apps Manager dialog box open, select WQ Calibrator from list of applications and click on the
Run button. This will load the WQ Calibrator dialog box appears on the screen. The dialog box appears as shown below.
Step 2: Select Pipe Wall Calibration Groups
The first step in the calibration process is to define the pipe calibration groups. Pipes should be grouped together based on similar characteristics such as material, age, and diameter. It is assumed that all pipes within a group will have the same wall coefficient. For this example, four pipe calibration groups have already been created.
-
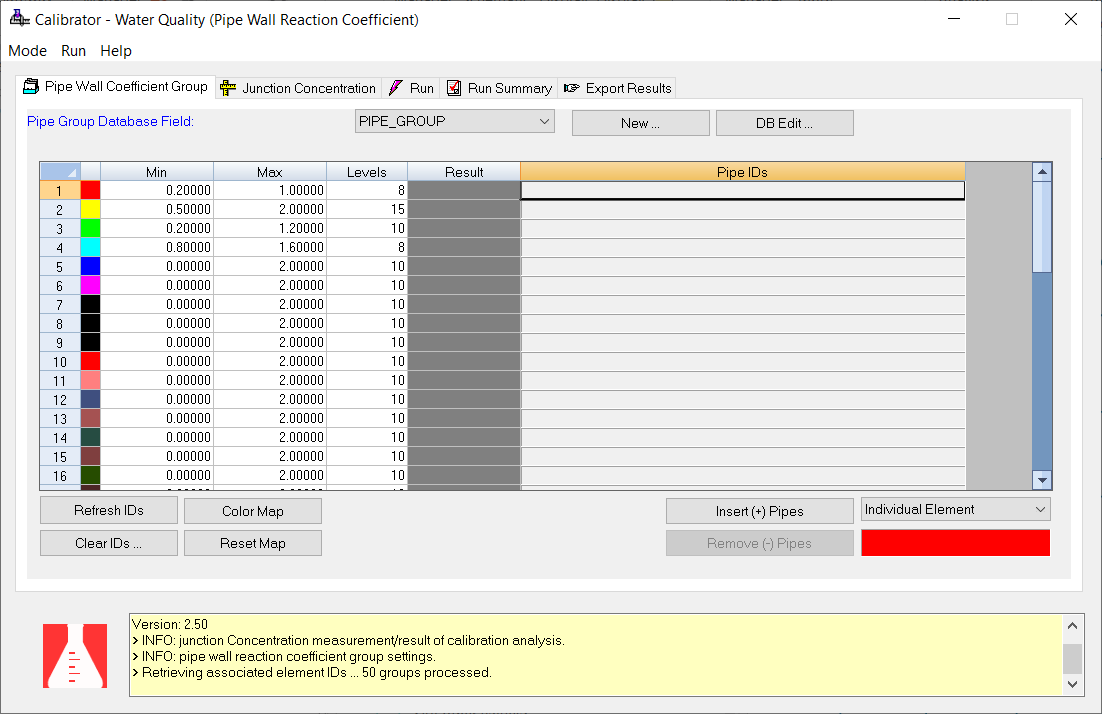
Select the PIPE_GROUP database field in the Pipe Group Database Field drop-down list as shown below. The pipe IDs for each group will be displayed on the Pipe Wall Coefficient Group tab.
To create different pipe groups, the following steps would then be required.
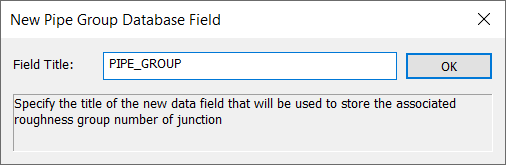
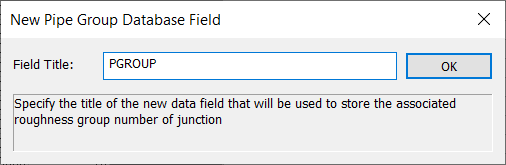
- Select the
New button and enter PGROUP in the Field Title of the New Pipe Group Database Field dialog box.
- Choose the DB Edit button and click on the Open button to open a database table. When the Open Table dialog box appears on the screen, choose the Pipe Information table from the drop-down list, select ALL (indicating you want the entire contents of the table to be displayed and available for editing), and choose OK. The Pipe Information table appears on the screen.
- You will now enter the pipe calibration group ID for each pipe in the PGROUP data field as defined above.
- Select the Save button and then choose the Close button at the top of the Database Editor window.
- Close the Database Browser by selecting the Exit button at the top of the Database Editor.
Step 3: Define Bounds For Pipe Wall Coefficients
The next step is to define the desired minimum and maximum limits for the pipe wall coefficients and their associated increments for each of the four calibration groups. Use the table below as a guide when entering this data.
| Group ID | Min. | Max. | Levels |
| 1 | 0.2 | 1 | 8 |
| 2 | 0.5 | 2 | 15 |
| 3 | 0.2 | 1.2 | 10 |
| 4 | 0.8 | 1.6 | 8 |
Based on the levels specified above, the wall coefficient in the four pipe calibration groups will be incremented with equal increments of 0.1.
The Pipe Wall Coefficient Group tab now appears as follows.
Step 4: Set Target Concentrations
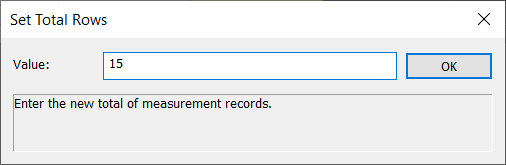
You will now specify the target concentration measurements at target junction nodes in the system. A total of 15 measurements at 4 distinct junction nodes will be inputted.
- Choose the Junction Concentration tab, click on the
Set Rows… button and enter “15” as shown below.
-
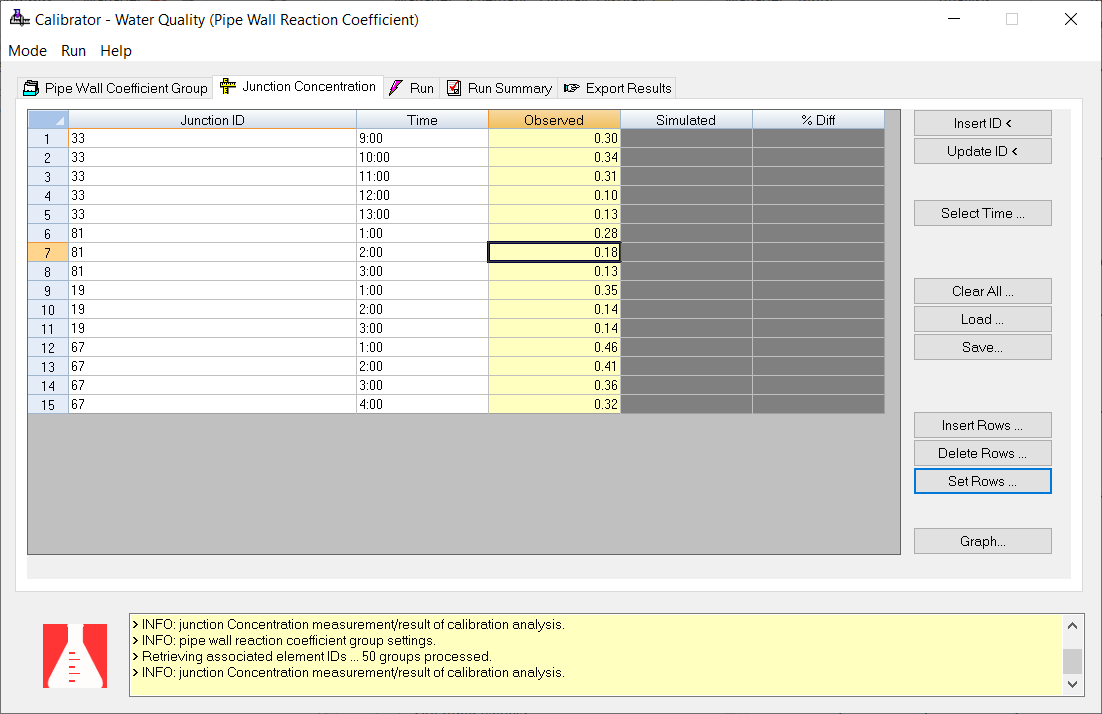
Enter the data shown below.
Junction ID Time Observed 33 9:00 0.30 33 10:00 0.34 33 11:00 0.31 33 12:00 0.10 33 13:00 0.13 81 1:00 0.28 81 2:00 0.18 81 3:00 0.13 19 1:00 0.35 19 2:00 0.14 19 3:00 0.14 67 1:00 0.46 67 2:00 0.41 67 3:00 0.36 67 4:00 0.32 The Junction Concentration tab now appears as follows.
Step 5: Select Calibration Run Options
Now that you have completed the process of creating a calibration run, the next step is to define your calibration run options. You will check the “Force Calibration on Pipe Groups” option and use “1” for the Global Pipe Wall Reaction Coefficient”. You will use a “Concentration Measurement Evaluation Threshold (%)” of 10 percent. You will specify a type 1 objective function (default value), a “Fitness Threshold” of 1 percent, a “Least Fitness Improvement” of 0.1 percent, a “Least Improvement Generation” of 100 (default value), and a maximum number of trials of 50,000 (default value).
- Choose the
Options command from the
Run menu and enter the data shown below in the Calibration Options dialog box.
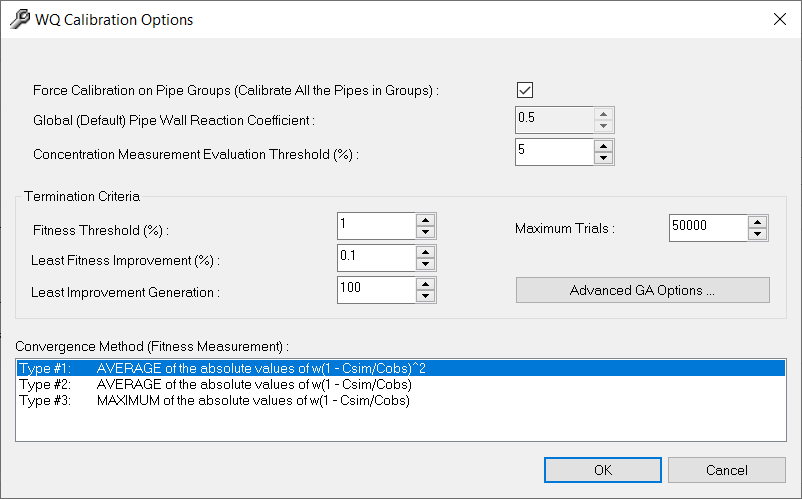
- Click on the OK button to close the dialog box.
Step 6: Run the Calibration Module
You have now entered all required information for the calibration model. To run the calibration module, choose the Start command from the Run menu. The Run tab appears on the screen.
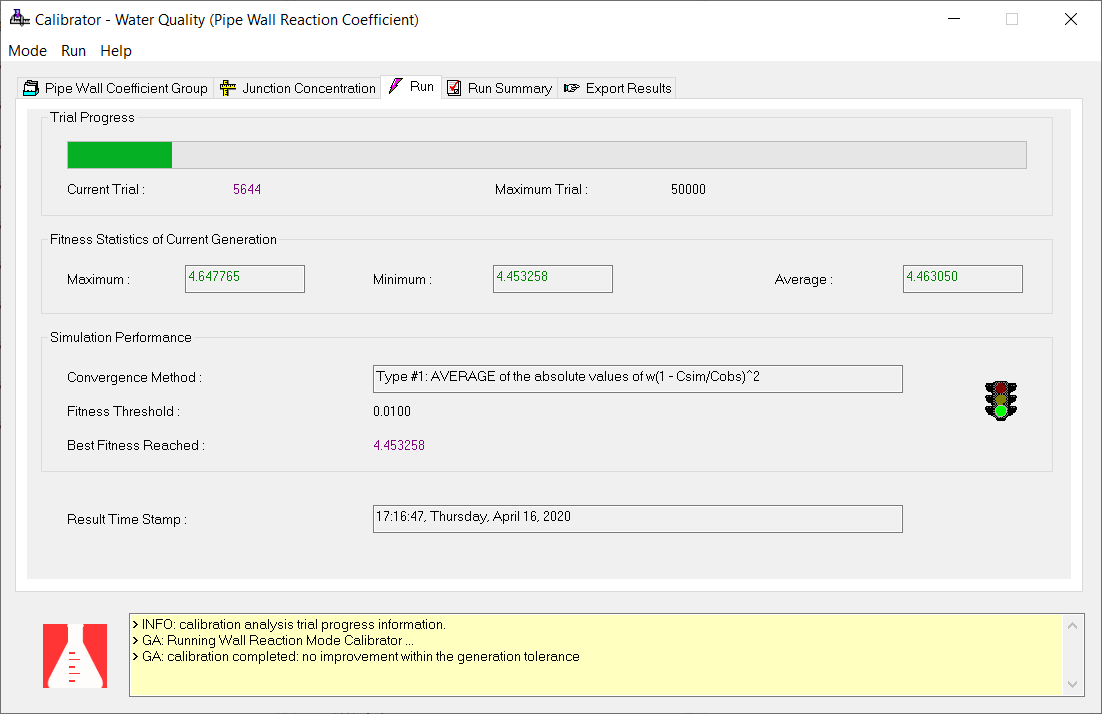
As shown in the Run tab, a fitness of 4.647765 was reached after 5644 trials for the type 1 fitness function specified.
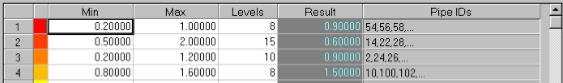
Step 7: Review the Calibration Results
The calibration results can be reviewed by choosing the Pipe Wall Coefficient Group tab as shown below. The calculated pipe wall coefficient for each pipe group is given below and satisfies the bound constraint.
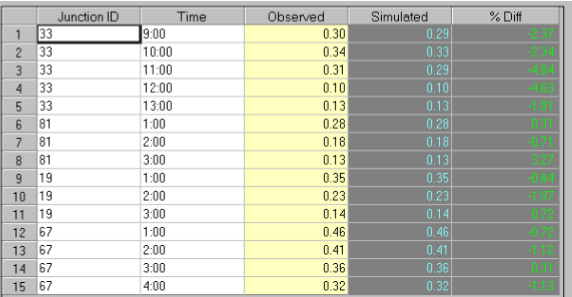
The table below shows the simulated and the observed junction concentrations.
You may also perform a more stringent calibration by selecting different calibration options to compare your calibration results.
Step 8: Export the Calibration Results
You can export the calibration results using the Export Results tab to the appropriate quality data set. To do this, perform the following:
- Choose the
Export Results tab. Click on the
Ellipsis
 button to enter the desired Data Set ID. Click on the
New
button to enter the desired Data Set ID. Click on the
New
 Icon and enter “RESULTS1” for the Quality Data Set ID.
- Choose the Export button to execute the export command. The calibration results are now saved to the appropriate quality data set.
Congratulations! You have now completed the Water Quality Calibration tutorial.