Any valve position (% open) change produces a transient. In order to create a transient using a valve operation, you need to assign two curves. First is the Active Valve Characteristic (AVC) curve, presenting “% stem position” vs. “minor loss K” and the other is the Operational Change Data (OCD) curve, presenting “time” vs. “% stem position”. The AVC curve presents the valve characteristic (e.g., gate valve, global valve). The OCD curve presents its stem position change during the transient analysis. The detail procedure of valve transient in surge analysis is shown as follows:
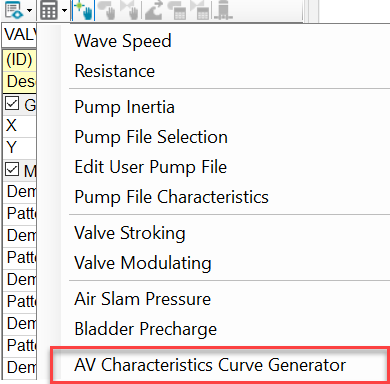
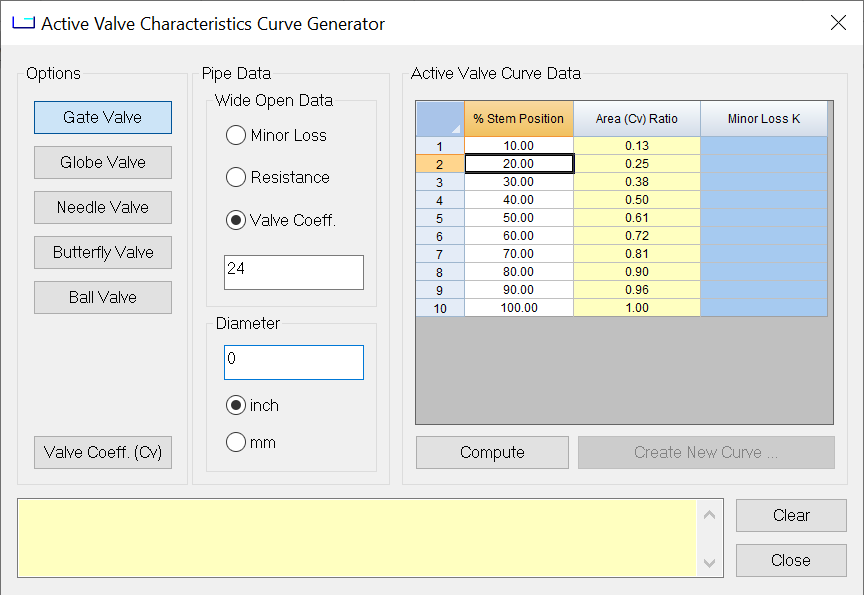
- In order to create the active valve characteristic curve, AV Characteristic Curve Generator (see the following) will help to create the active valve. After assigning your valve characteristic like the second figure, you can click on
Create New Curve button to create the curve.
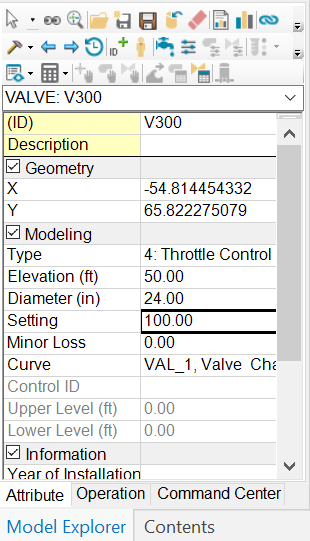
- After creating the active valve characteristic curve, it should be assigned in the valve Modeling Data as follows:
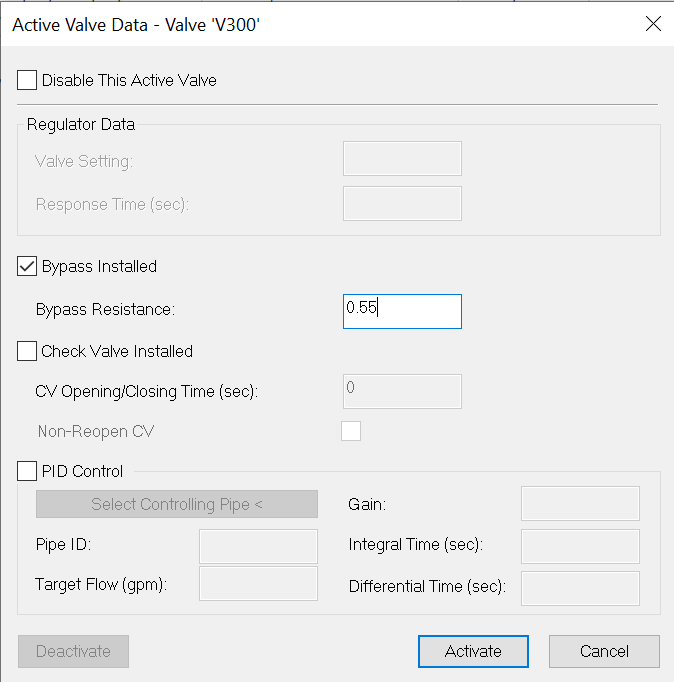
- Click on the AV Surge Data
 button, and then click
Activate to use this valve as an active valve in transient.
button, and then click
Activate to use this valve as an active valve in transient.
- Click on the AV (TCV) Operation Change button to create and assign stem change curve.
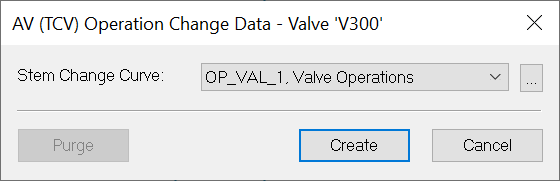
- Click in Stem Change Curve and then see Curve window.
- Click
New to make a new stem change curve (see the following example).

X axis indicates the time in seconds and Y axis presents the stem opening in percentage (100 means 100% opening; 0 means 0% closure). In this example, the valve is open first 2 seconds and then closed within 1 second.