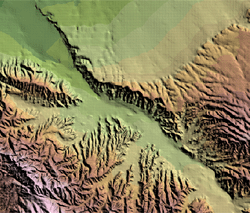
To theme terrain
Terrain Themes allow you to compare terrain based on Elevation, Aspect, or Slope.

.Click Manage
 Display
 to open the Terrain Themes Palette.
In the Terrain Shading palette, click
 (Add a New Theme).
In the Theme Parameters area, do the following:
Enter a name for the theme.
For Analysis Type, select Elevation, Aspect, or Slope.
Specify the Minimum and Maximum values.
Use these values to constrain the theme to specific areas. For example, when theming by elevation, enter a Minimum of 100 meters and a Maximum of 1000 meters to omit elevations at sea level and those above 1000 meters.
For Distribution, indicate the method used to determine the theme range. For details, see the "Advanced Tips" section below.
Indicate the Number of Rules.
If you are theming by aspect, for Minimum Horizontal Slope, indicate the lowest slope degree value to consider in the theme.
Under Color Range, specify the following:
- Transparency: Use the slider to indicate how much of the underlying styling you can see once the theme is applied. A higher setting makes the theme more transparent.
- Color From and Color To: InfraWorks creates a color ramp between the first color in the theme (Color From) and the Color To selection. The Preview area displays the color ramp.
- Palette Type: For details, see the "Advanced Tips" section below.
Click OK to apply the theme.
Advanced Tips
If you have added contours or rasters as part of the terrain, they are included in the theme. The results are shown as soon as you apply the theme. You do not need to regenerate the model.
The Preview area at the bottom of the dialog box shows the current theme settings.
The following distribution methods are available:
| Method | Description |
|---|---|
| Equal | The difference between the high and low values is the same for every range. This method is easy to interpret and is useful for showing continuous data such as height. |
| Standard Deviation | Features are placed in ranges based on how much their values vary from the mean. InfraWorks calculates the mean and then adds or subtracts the standard deviation to or from the mean to create the ranges. |
| Quantile | Each range contains an equal number of features. This method is useful for showing data in which values are evenly distributed. |
| Jenks (Natural Breaks) | Ranges are based on natural groupings of data values. Features with similar values are grouped. This method shows the natural groupings in the data. |
| Individual Values | Features are not grouped. This distribution is useful if values are not continuous, there is a fixed number of values, and many features have the same value. |
| Logarithm | Evaluates the highest and lowest value, and creates a logarithmic scale for distributing the values. This distribution is good for analyzing data distributed along multi-modal, and other non-normal curves. |
The following palette types are available:
| Palette Type | Definition | Description | Visual |
|---|---|---|---|
| HSV CCW | Hue, Saturation, Value; Counterclockwise | Determines the interim colors between the Color From hue and the Color To hue going counter-clockwise. |  |
| HSV CW | Hue, Saturation, Value; Clockwise | Determines the interim colors between the Color From hue and the Color To hue going clockwise. |  |
| RGB | Red, Green, Blue | Determines the interim colors based on their red, green, and blue components. |  |
| User Defined | Click the browse button next to this field to see the Set Up User Defined Colors dialog box, where you can select individual colors for the elements in the color ramp. |