To inspect the hydraulic performance of a pipe run
Inspect visually and check data for the hydraulic and energy grade-lines for a selected pipe run. Identify surcharged pipes and flooded manholes. Adjust AEP setting to model performance under different storm level conditions.

Run Size Drainage Network if you have not run it since making changes to the drainage network. Click Analyze
 Drainage
 (Size Drainage Network)
Click Analyze
 Drainage
 (Inspect Performance)
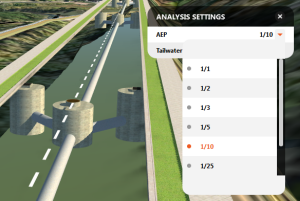
Optionally, before selecting the first pipe connector, adjust the AEP setting, as needed. Default setting = 1/10.

Follow tool tip instructions at bottom of canvas.
Note: You cannot select underground drainage structures from (through) the road or terrain surface. Navigate beneath the surface to select the structures.Select a first pipe connector. (Selection highlights yellow.)

To change a selection of a pipe connectors before analysis starts, click the connector again to deselect it, then select a different one.
Select a second connector from the eligible connectors. (Highlighted purple.)
The pipe run to be analyzed is now marked between two yellow connectors.

Click Enter to start the analysis.
Inspect Performance returns:
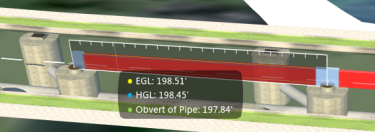
Labels a surcharged inlet or a flooded manhole.

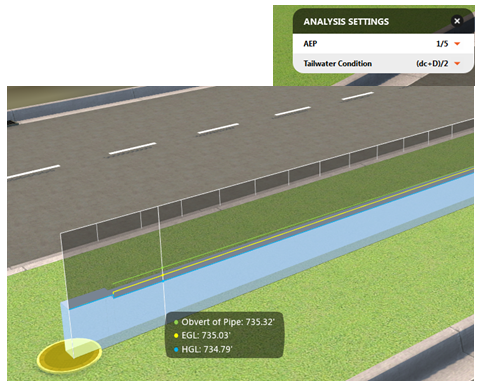
Visual analysis of the hydraulic and energy grade-lines, measured against the obvert of the pipe. To check the data, move the cursor over the vertical bar along the hatched bounding box.

- Blue bar: the depth of water in the pipe (not the flow); that is, the hydraulic gradeline.
- Green line: the obvert, or inside, of the pipe.
- Yellow line: the energy gradeline.