To obtain Peak Flows data
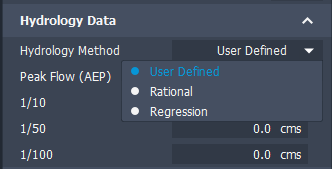
On a selected watershed's Stack panel, choose a hydrology method for obtaining Peak Flows data or supply data manually.
InfraWorks supports two hydrology methods for obtaining watershed Peak Flows data: Rational or Regression. In addition, you can enter data manually. The Q100 value (100-year flow) is used to calculate the watershed Flow for culverts added to the model.
Click a watershed to select it and display its Stack panel.
Choose a Hydrology Method from the drop down menu: User Defined, Rational, or Regression.

Provide values in editable fields to generate Peak Flows values (1/10 = Q10, 1/50 = Q50, and 1/100 = Q100).
Note: Drainage Design uses US Geological Survey National Streamsflow Statistics (NSS) database to derive Peak Flows for tributaries in a watershed.
Value Fields for Hydrology Methods
| Hydrology Method | Notes |
|---|---|
| User Defined | Enter values for Q10, Q50, Q100 from your data source. |
| Rational | Runoff Coefficient: Enter a value manually from your data source. Rainfall Intensity: Enter a value manually from your data source. |
| Regression | State: Choose from states with data available. Region: Choose from regions available. Depending on the State and Region, add additional values manually. Reference information is available from the USGS National Streamflow Statistics Program. Contributing Drainage Area: This value is calculated for the selected watershed and is the same as the Area value listed in the watershed stack Summary section. |