In the Simulation  Result Type panel, click the following commands to visualize results:
Result Type panel, click the following commands to visualize results:
-
 Flow Rate
-
 Reynolds Number
-
 Pressure
-
 Velocity
-
 Temperature.
Note: In
Revit, you can use different project unit settings for HVAC and piping systems.
React Fluids keeps these settings from a
Revit project. To ensure that the result maps are easy to read, it uses separate legends to display results for these systems.
To visualize the direction of the flow in system elements, click
Simulation Flow Direction Show arrows.
To visualize the flow velocity, click Animate Flow. The animated velocity is proportional to the actual flow velocity specified for elements. It lets you quickly identify areas of the system where the flow velocity is insufficient.
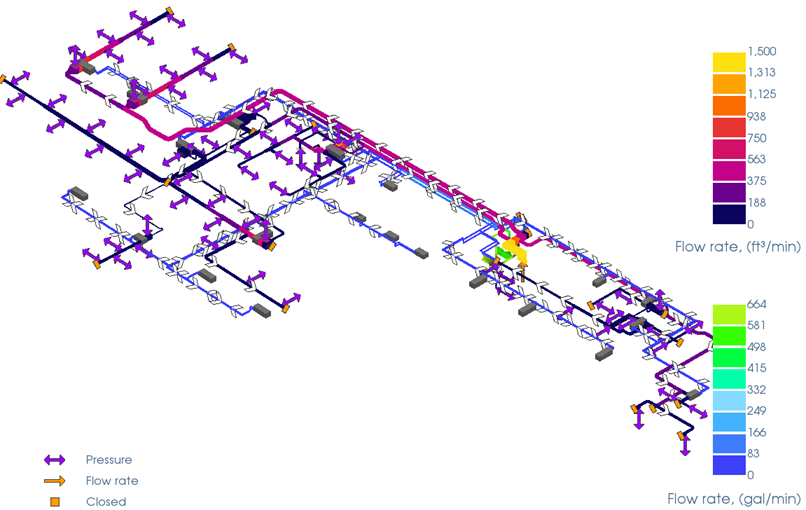
Flow rate results and flow direction arrows for ducting and piping networks
To view results for a specific item in the system
- In the Model Pane, click an item.
- In the Properties panel, view the Results section.