The Browser displays a tree view of all the elements of the distribution system.
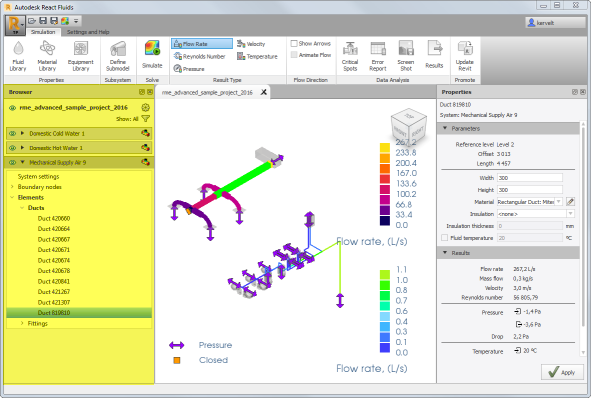
By default the Browser is located on the left of the model pane.
Display Options
To display the Browser, click
Settings and Help  Visibility Browser, or right-click anywhere in the ribbon and then click
Browser.
Visibility Browser, or right-click anywhere in the ribbon and then click
Browser.
Drag an edge of the Browser to resize it, or drag its title bar to change its location.
You can also close the Browser to allow for more working space in the model pane.
Using the Browser
The content of the browser depends on the systems and elements available in the project.
Select an element or a category of elements in the Browser to highlight them in the Graphical Area, and to display the corresponding parameters in the Properties Pane. By default, the selected elements are highlighted in green in the model pane.
| Browser Item | Description |
|---|---|

|
Opens the System Manager dialog where you can set up parameters such as the type of fluid used in the system or the ambient temperature. You can also modify the visibility and the color of the system. |

|
Displays or hides the selected system in the graphical area.
A blue icon indicates that the corresponding system is visible; a grey icon indicates that the system is hidden. To hide or display all systems in the graphical area, click
|


|
Expands or collapses the list of categories and elements of the system.
Categories include: system settings, boundary nodes, elements, and equipment. |


|
Expands or collapses the list of lower-level elements.
You can also use the key arrows to navigate between branches. |
Simulation Results
When you run the simulation on a system a new set of icons displays on the right-hand side of the browser. These icons give an indication on the simulation status.
| Results Status | Description |
|---|---|

|
The simulation is running. |

|
Results are available and up-to-date. |

|
Results are available but they are no longer valid because of a change in the system parameters.
To update the results, run the simulation again. |

|
The simulation failed. |