- Access
- Results

 Bar Maps
Bar maps show color maps of sectional forces, moments, and stresses on the bars of the structure.
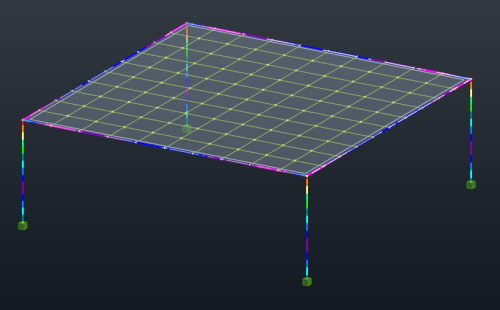
Example of maps showing maximum stresses on the bars of a structure.
Visualization Options
| Icon | Name | Description |
|---|---|---|

|
Labels | Displays the result values as labels on the model.
The maximal and minimal values are also displayed respectively in red and green. |

|
Texts | Displays the result values on the model. |

|
Clear | Hides the bar diagrams on the model. |
NTM / Stresses
| Axial Force |
 Fx Fx
|
|||
| Shear Force |
 Fy Fy
|
 Fz Fz
|
||
| Torsional Moment |
 Mx Mx
|
|||
| Bending Moment |
 My My
|
 Mz Mz
|
||
| Stress |
 Maximum S max Maximum S max
|
|||
 Minimum S min Minimum S min
|
||||
| Axial Stress |
 Fx / Ax Fx / Ax
|
|||
| Bending Stress S max |
 My My
|
 Mz Mz
|
||
| Bending Stress S min |
 My My
|
 Mz Mz
|
||
| Torsional Stress |
 Tx Tx
|
|||
| Shear Stress |
 Ty Ty
|
 Tz Tz
|