- Access
- Results

 Bar Diagrams
Bar diagrams show axial and shear forces as well as bending moments and stresses on the structure.
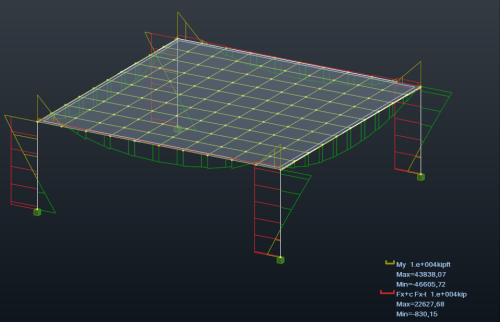
Example of Bar Diagrams showing axial forces and bending moments on a structure
Visualization Options
| Icon | Name | Description |
|---|---|---|

|
Normalize | Adjusts the scale automatically based on the minimal and maximum values. |

|
Enlarge | Enlarges the scale factor to magnify the diagrams in the structure. |

|
Reduce | Reduces the scale factor to minimize the diagrams in the structure. |

|
Labels | Displays the result values as labels on the model.
The maximal and minimal values are also displayed respectively in red and green. |

|
Texts | Displays the result values on the model. |
| Value Types | Filters the result values by local or global extremes. | |

|
Differentiate positive and negative values | Uses two different colors to easily distinguish positive values from negative values. |

|
Filling | Fills the diagrams with a predefined color to facilitate their visualization. |

|
Clear | Hides the bar diagrams on the model. |
NTM / Stresses
| Axial Force |
 Fx Fx
|
|||
| Shear Force |
 Fy Fy
|
 Fz Fz
|
||
| Torsional Moment |
 Mx Mx
|
|||
| Bending Moment |
 My My
|
 Mz Mz
|
||
| Stress |
 Maximum S max Maximum S max
|
|||
 Minimum S min Minimum S min
|
||||
| Axial Stress |
 Fx / Ax Fx / Ax
|
|||
| Bending Stress S max |
 My My
|
 Mz Mz
|
||
| Bending Stress S min |
 My My
|
 Mz Mz
|
||
| Torsional Stress |
 Tx Tx
|
|||
| Shear Stress |
 Ty Ty
|
 Tz Tz
|
||
| Elastic Ground Reaction |
 Ky Ky
|
 Kz Kz
|