Analyze Page Performance
Analyzing a Page's Performance is designed to give Flow Production Tracking administrators the toolset for identify parts of a grid page that are causing higher load times, enabling users to improve these areas.
The panel is available via the Page dropdown menu ![]() by selecting Analyze Page Performance.
by selecting Analyze Page Performance.
The TOTAL PAGE LOAD TIME is broken down into the following areas:
- Backend Query Time
- Browser Processing
- Page Results
- Page Components
 Contents
- Backend Query Time
- Support and limitations
- Optimizing filters and API scripts to make your Flow Production Tracking site faster
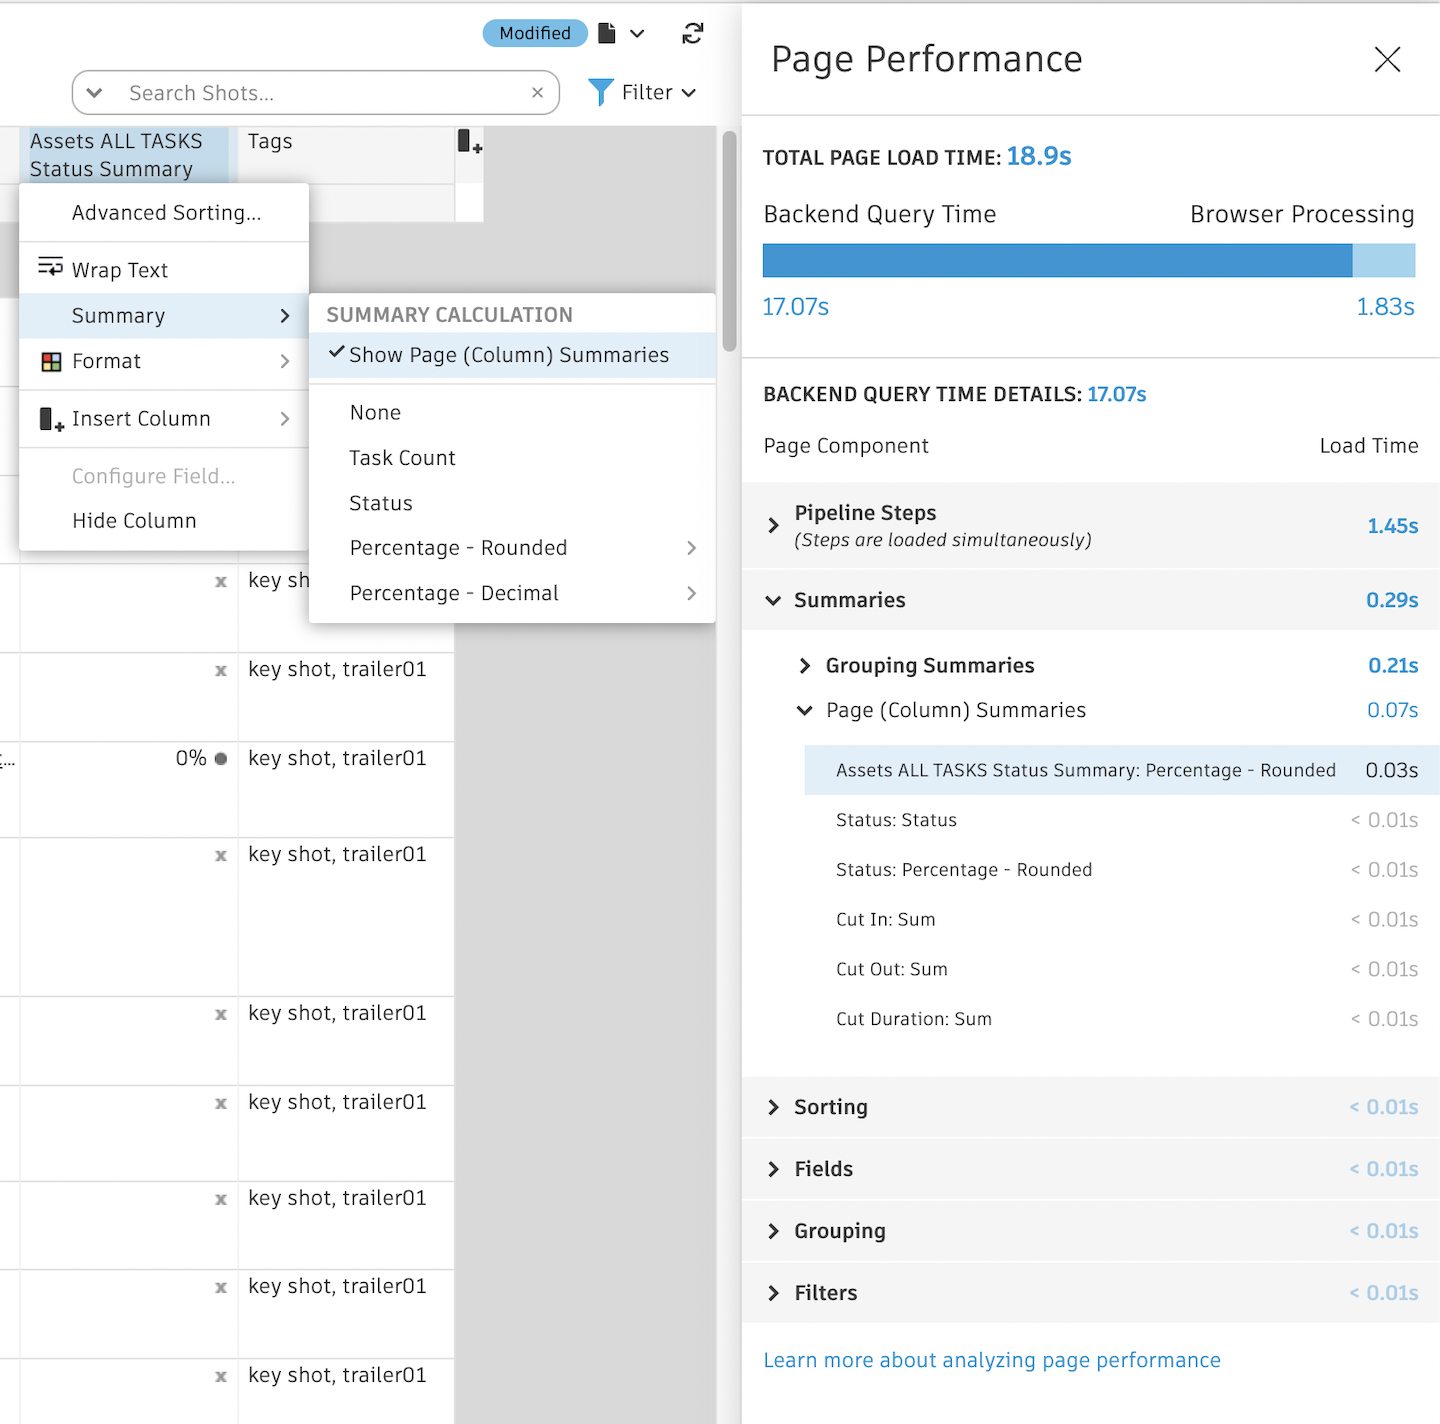
Backend Query Time
Backend Query Time includes the parts of Flow Production Tracking that are modifiable. These parts are broken down into Page Components that are expandable.
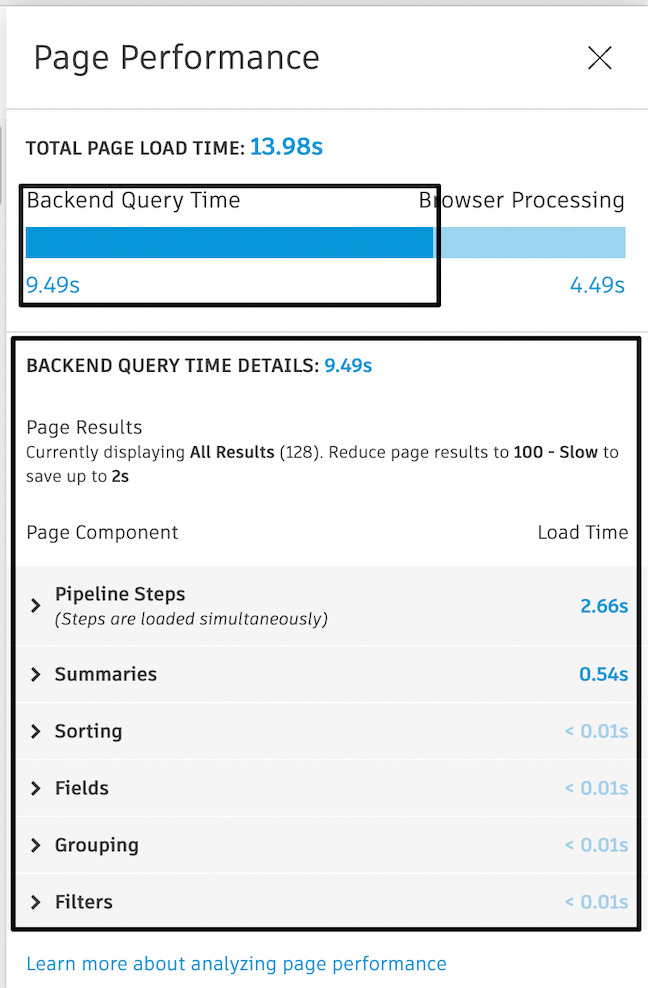
Page Results
Page results are adjustable on grid pages at the bottom of the page.
Page Components
Page Components are expandable and include load times for the following:
- Fields
- Filters
- Grouping
- Sorting
- Pipeline Steps
- Summaries
These components are sorted by load time—from highest load (top) to lowest load (bottom) for each Page Component category.
Individual Page Components
Each Page Component category is broken down into the load time for the individual Page Components, and can be drilled into further when expanding the Page Component.
Page Component grouping levels vary; while some Page Components have one level (e.g. Fields, Sorting, etc), others have many levels (e.g. Pipeline Steps).
Interacting with the individual Page Components
You can interact with the individual Page Components by selecting the component in the panel. Depending on the selections, an action will occur to help you quickly optimize identified areas:
- Fields: when selecting a Field Page Component, column headers are highlighted on the grid and you are directed to those columns if they are not in view
- Filters:
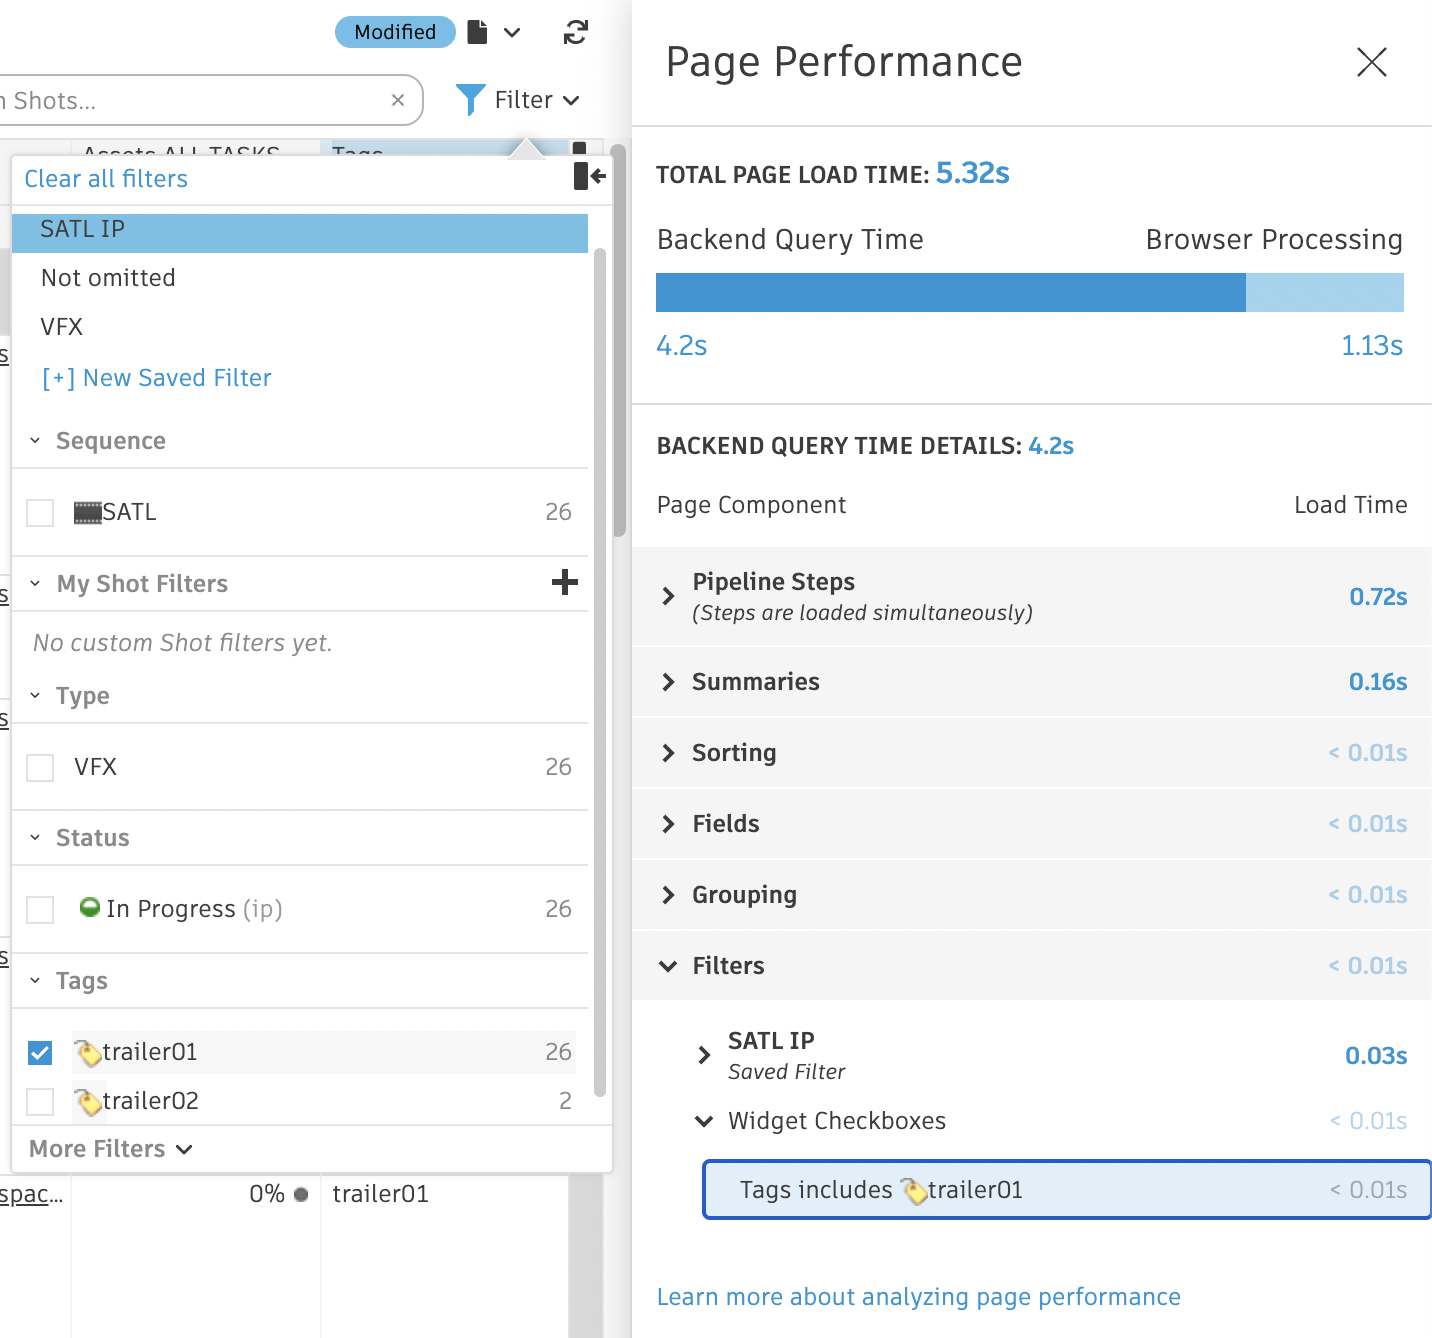
- Widget Checkboxes: Widget checkboxes are Widget Filters that are enabled in the Filter Panel. When selecting a Widget Checkbox Page Component, you will be directed to that enabled checkbox in the Filter Panel
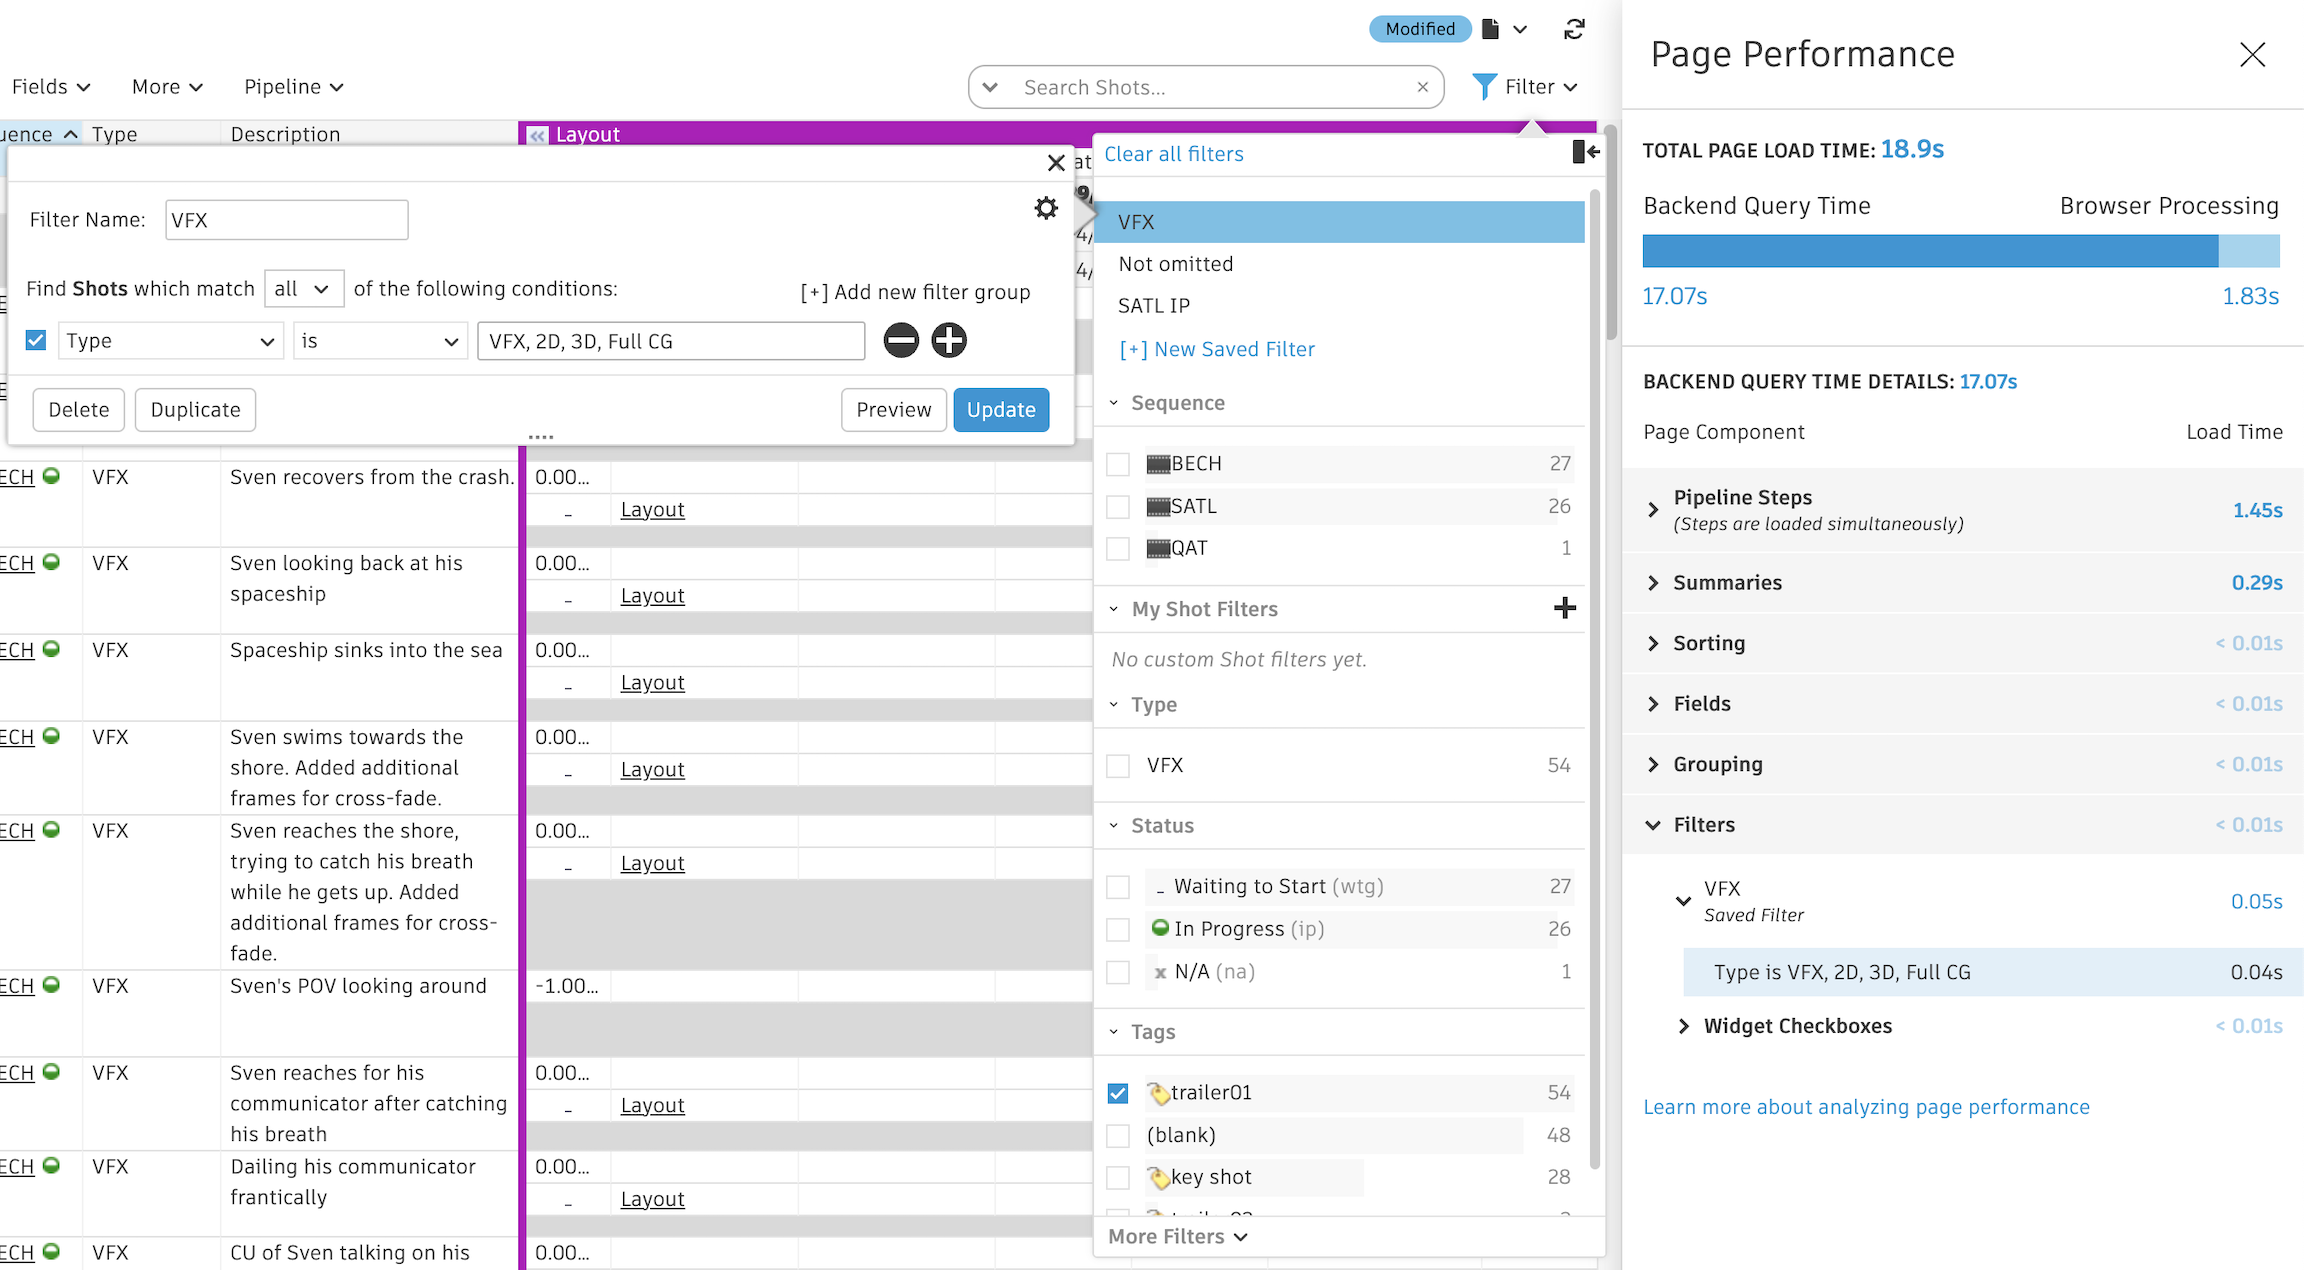
- Page Filters: Only Page Filters that are active on the Page will appear as a Page Component listed as the Page Filter name. When selecting a Page Filter, you will be directed to the editing window for that Page Filter
- Widget Checkboxes: Widget checkboxes are Widget Filters that are enabled in the Filter Panel. When selecting a Widget Checkbox Page Component, you will be directed to that enabled checkbox in the Filter Panel
- Summaries: when selecting a Summary Page Component, you will be directed to that column summary configuration on the page
- Sorting: when sorting on a single field, you will be directed to that item in the Sort dropdown. With advanced sorting, you will be taken to the Advanced Sorting configuration window for that column
- Grouping: when grouping on a single field, you will be directed to that item in the Group dropdown. With advanced grouping, you will be taken to the Advanced Grouping configuration window
The same behavior listed above will occur for the Pipeline Step individual Page Components, depending on what you select (e.g. Summaries, Fields, Sorting).
Understanding load times
Load times
- Components that have negligible load time will appear with a
< 0.01s - Components that are not applicable for the page appear in a greyed-out state with a
--(double dash) in lieu of a load time.
Total load times may not reflect the sum of the Page component constituent measurements as some operations are computed simultaneously.
Total Page load time
- The TOTAL PAGE LOAD TIME reflects the Backend Query Time and Browser Processing loading times added together. The Backend Query Time includes Page Components (parts of Flow Production Tracking that are modifiable and listed in Page Components).
The Backend Query Time may appear larger than the combined time of all Page Components due to other performance variables that cannot be controlled by users.
Making updates to a Page
When making updates to a Page while the Page performance panel is open, you will see a message at the top of the panel: This analysis is outdated due to changes made to this Page. To analyze this unsaved Page, select Analyze.
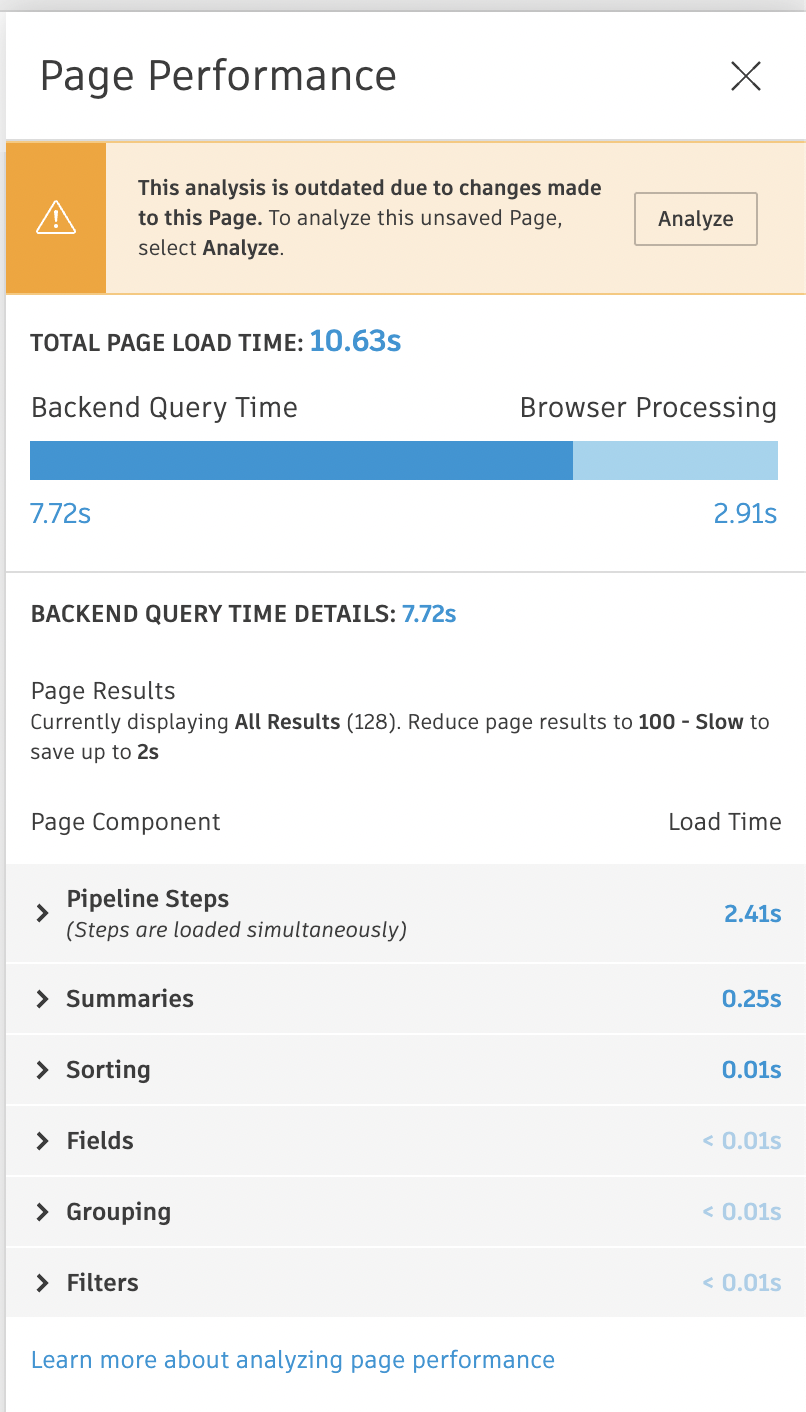
This will allow you to make multiple updates to a page without saving the page prior to analyzing the Page performance again and refreshing the load times. Then, once you are ready to analyze unsaved changes, select Analyze and the panel will reload.
Support and limitations
Analyze Page Performance is only available on grid Page types.
Optimizing filters and API scripts to make your Flow Production Tracking site faster
To optimize page filters and API scripts to make your Flow Production Tracking site faster, visit the Optimizing filters and API scripts to make your Flow Production Tracking site faster topic to learn more.