Designing report pages
In Flow Production Tracking, you can design pages that act as reports.
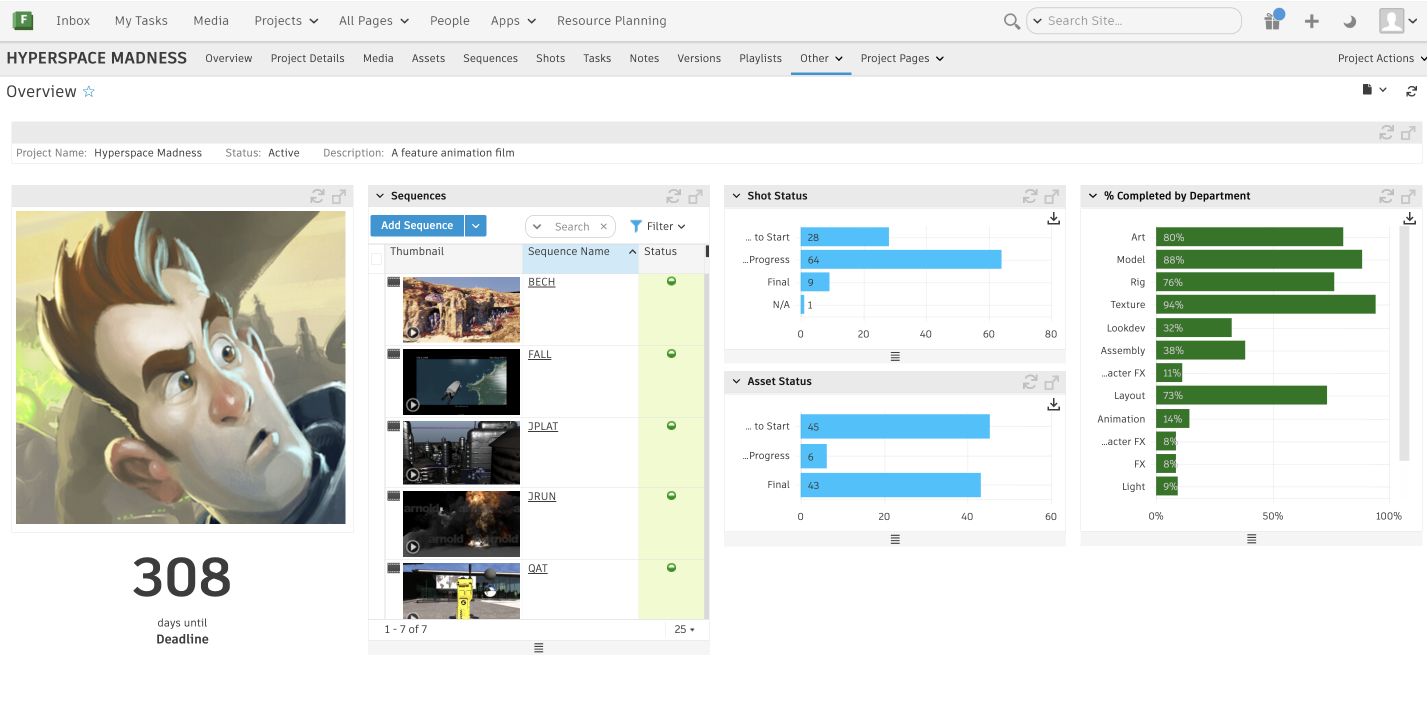
The following instructions will help you create a report, such as the one above, but the same techniques can be used to create a wide variety of custom report pages. To start, you will need to design a canvas page.
Step 1: Add rows to the page.
Add four rows, with the following number of columns in each:
- Row 1: one column
- Row 2: four columns
Step 2: Add a label widget, from the list of available widgets, to the first row.
To configure the first row, add a label widget with the “One Line” display. Make sure the label widget has the following fields:
- Project Name
- Status
- Description
Step 3: Add a single thumbnail widget and a countdown widget to the first column in the second row.
Then configure your widgets:
- The single thumbnail widget should be of your Current Project.
- The countdown widget should have the event date as the date the project is due.
Step 4: Add a grid widget to the second column in the second row.
Then configure your widget:
- Choose Sequence for the type of grid.
- Include the “Sequence Name” and “Status” fields in the grid.
Step 5: Add two graph widgets to the third column in the second row.
Then configure your widgets:
- The first graph should show the Shot Status:
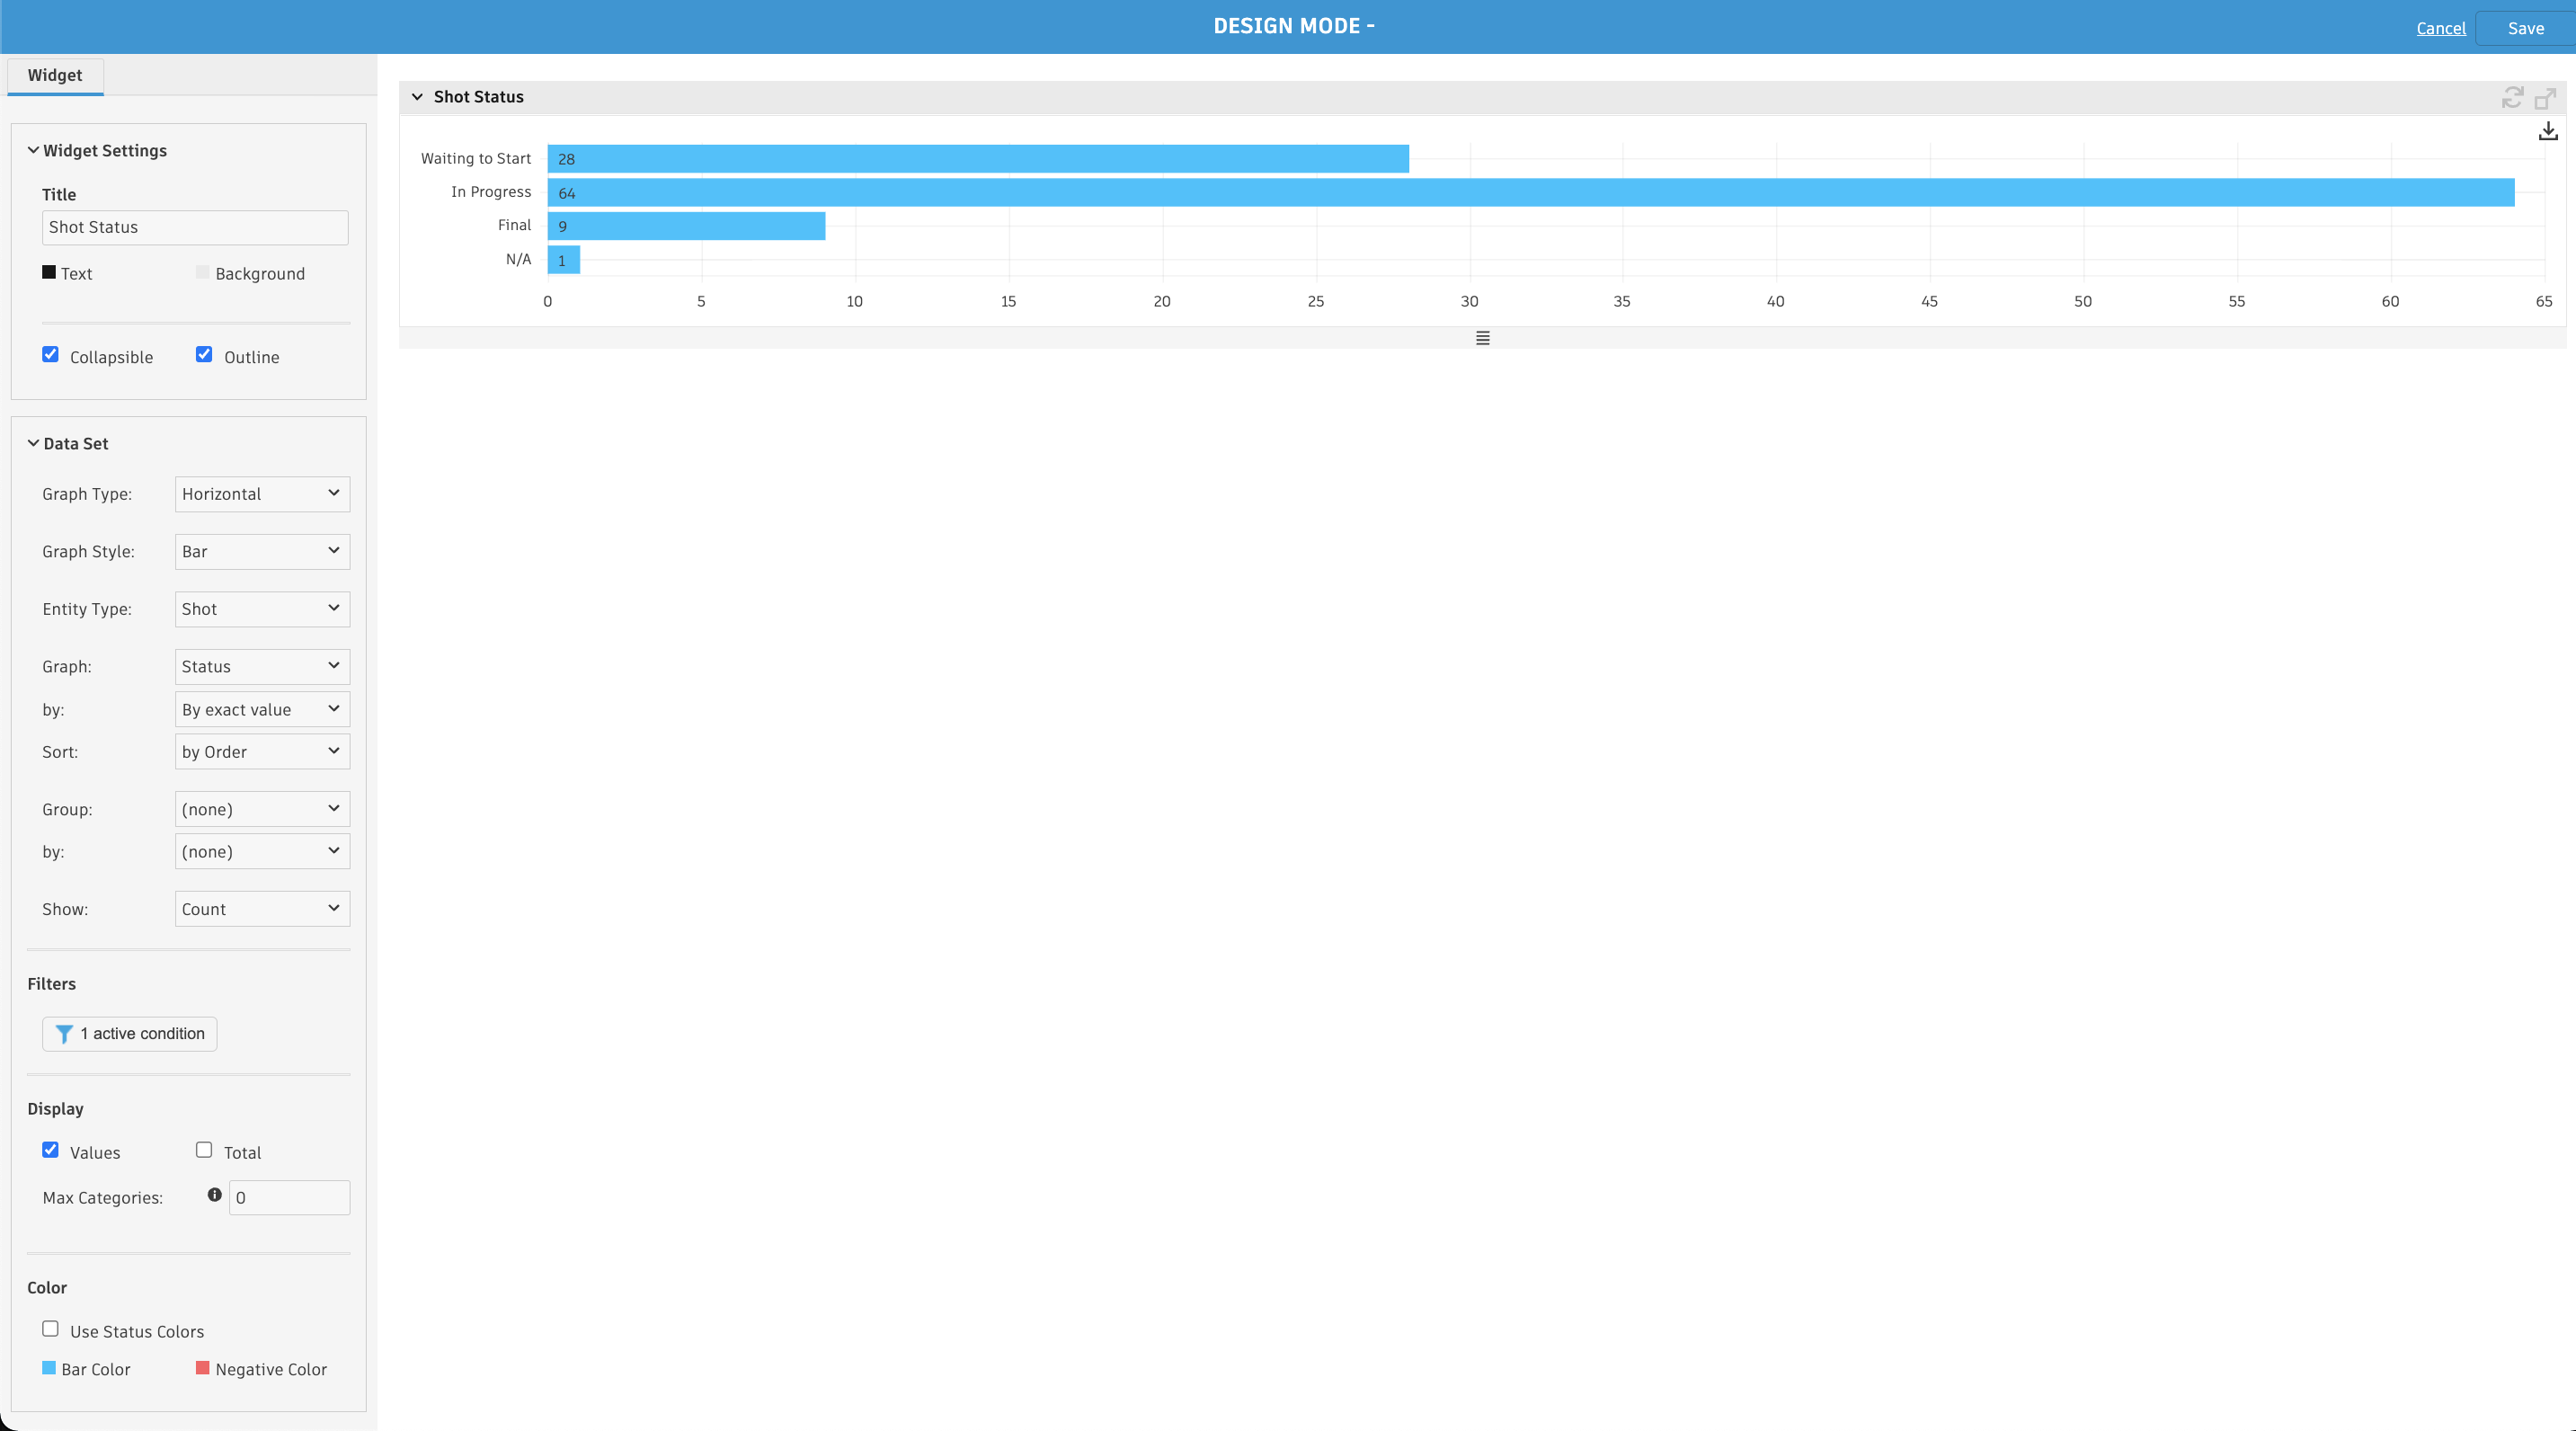
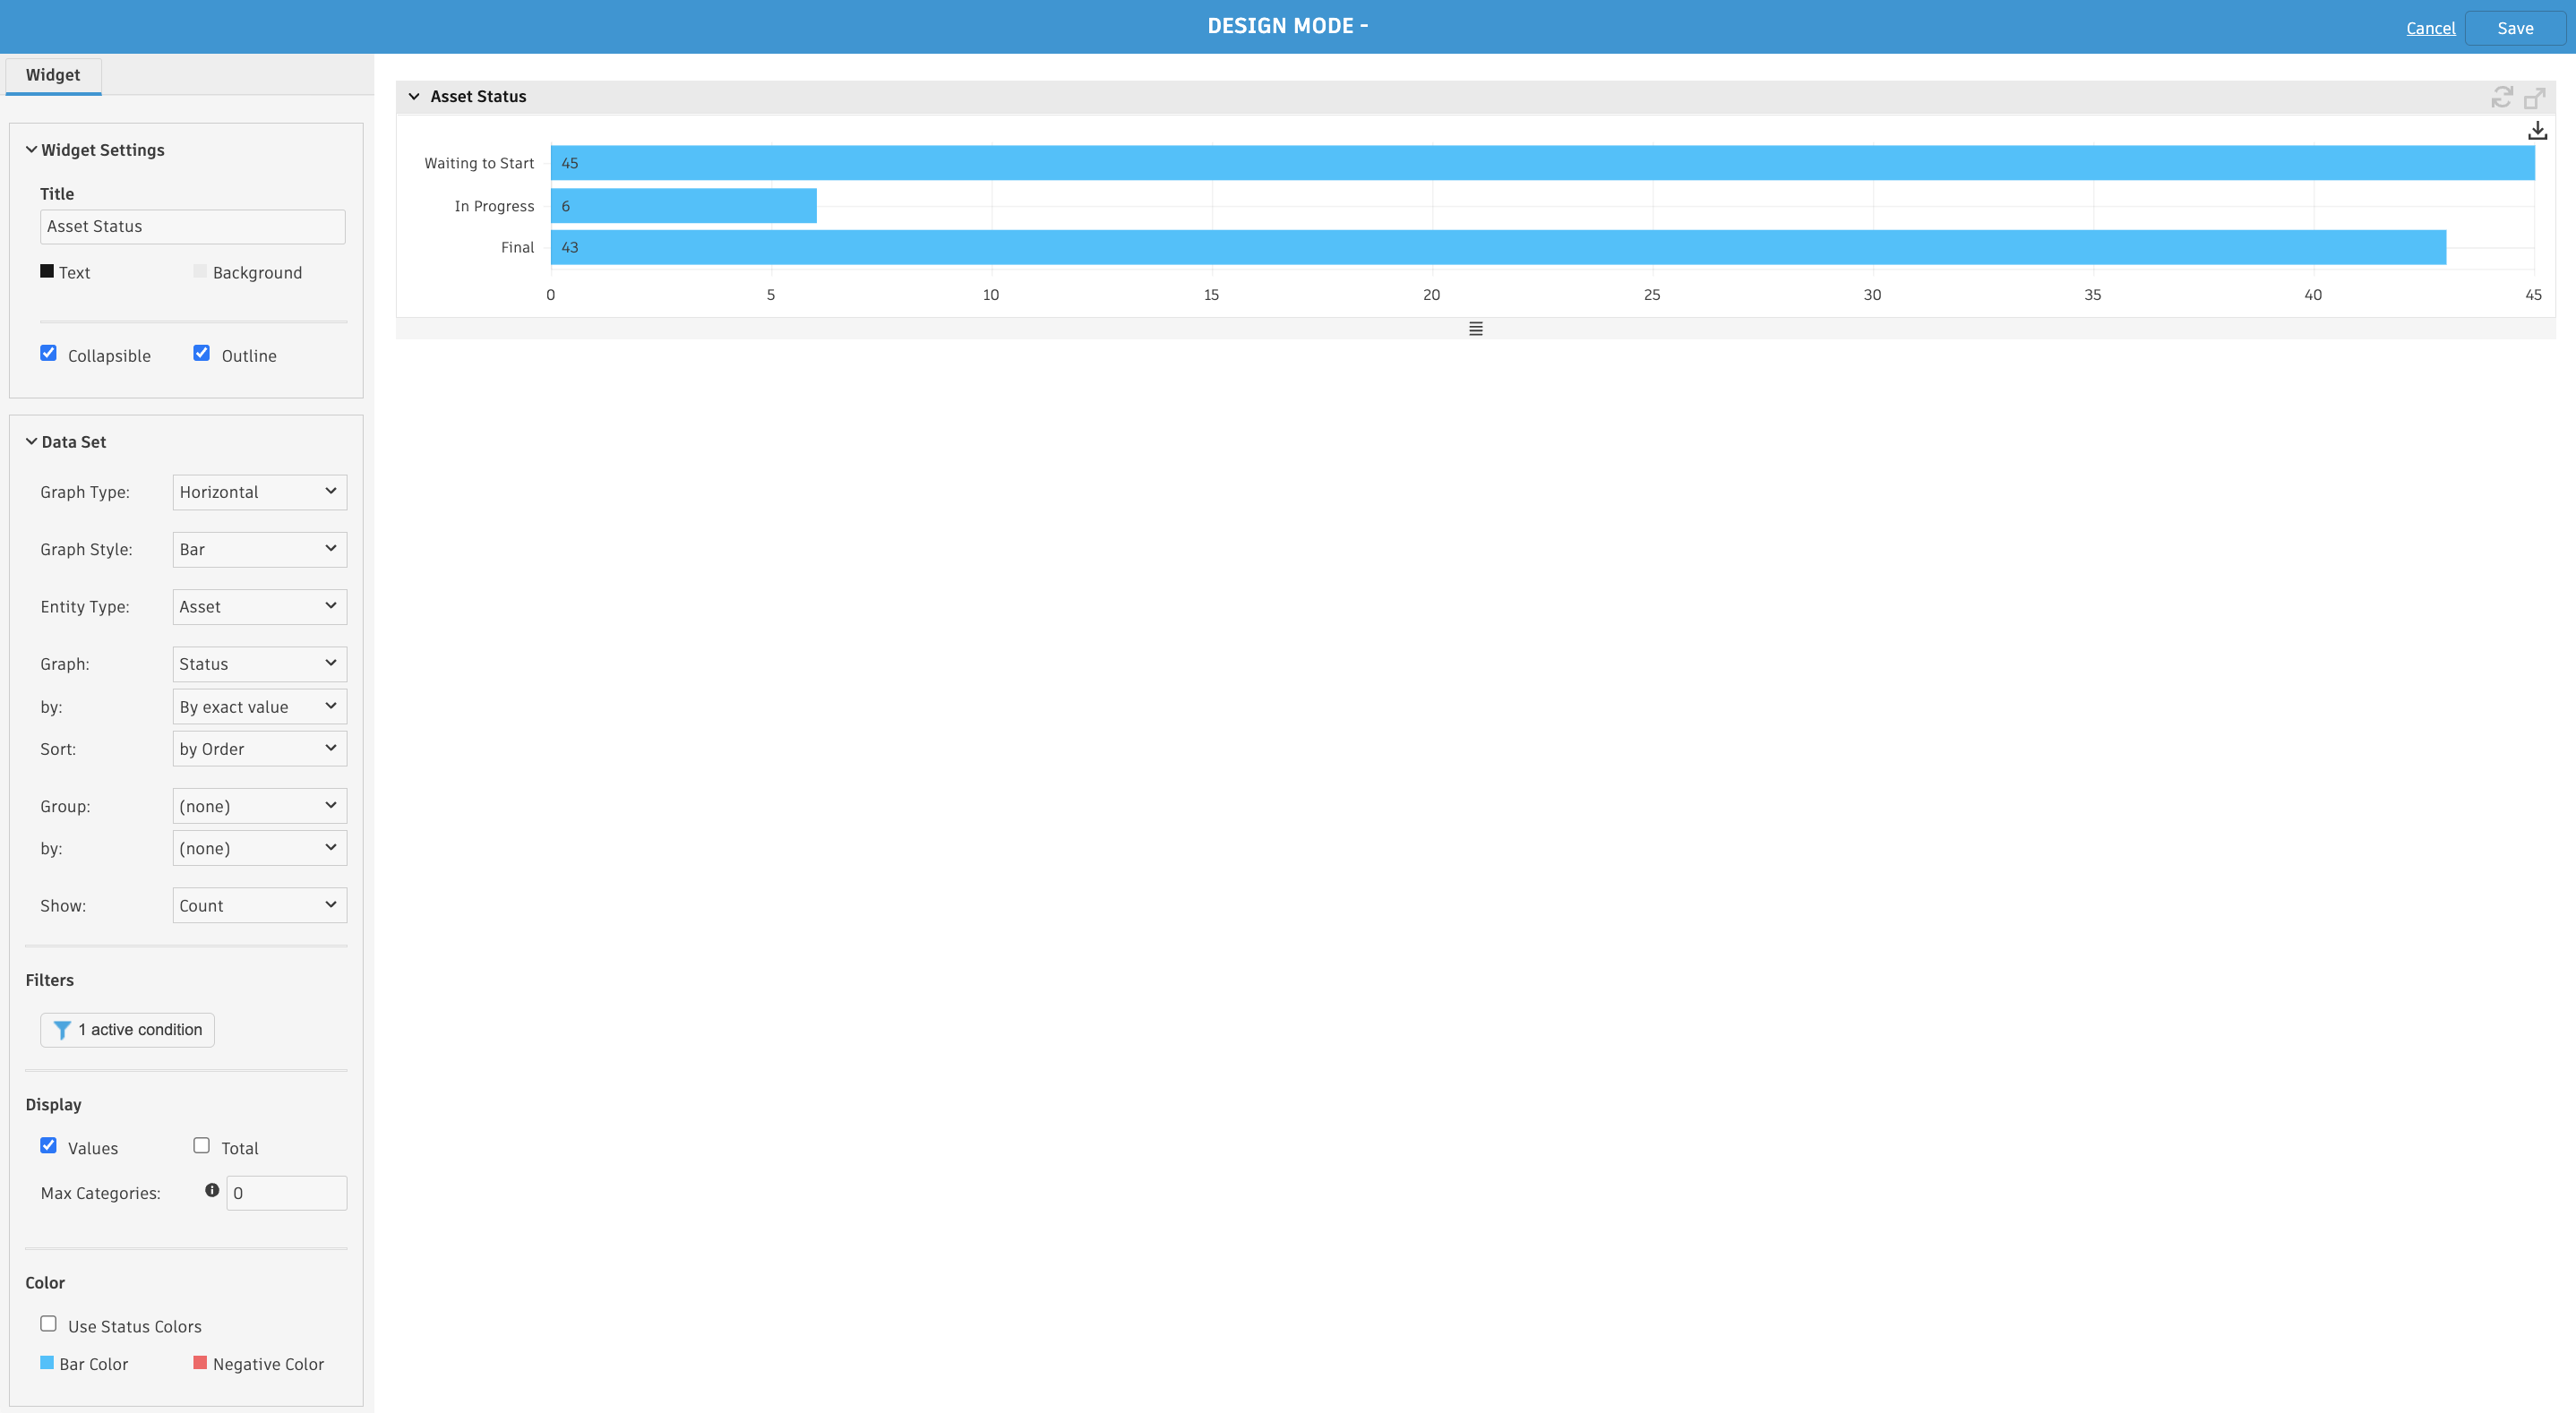
- The second graph should show Asset Status:
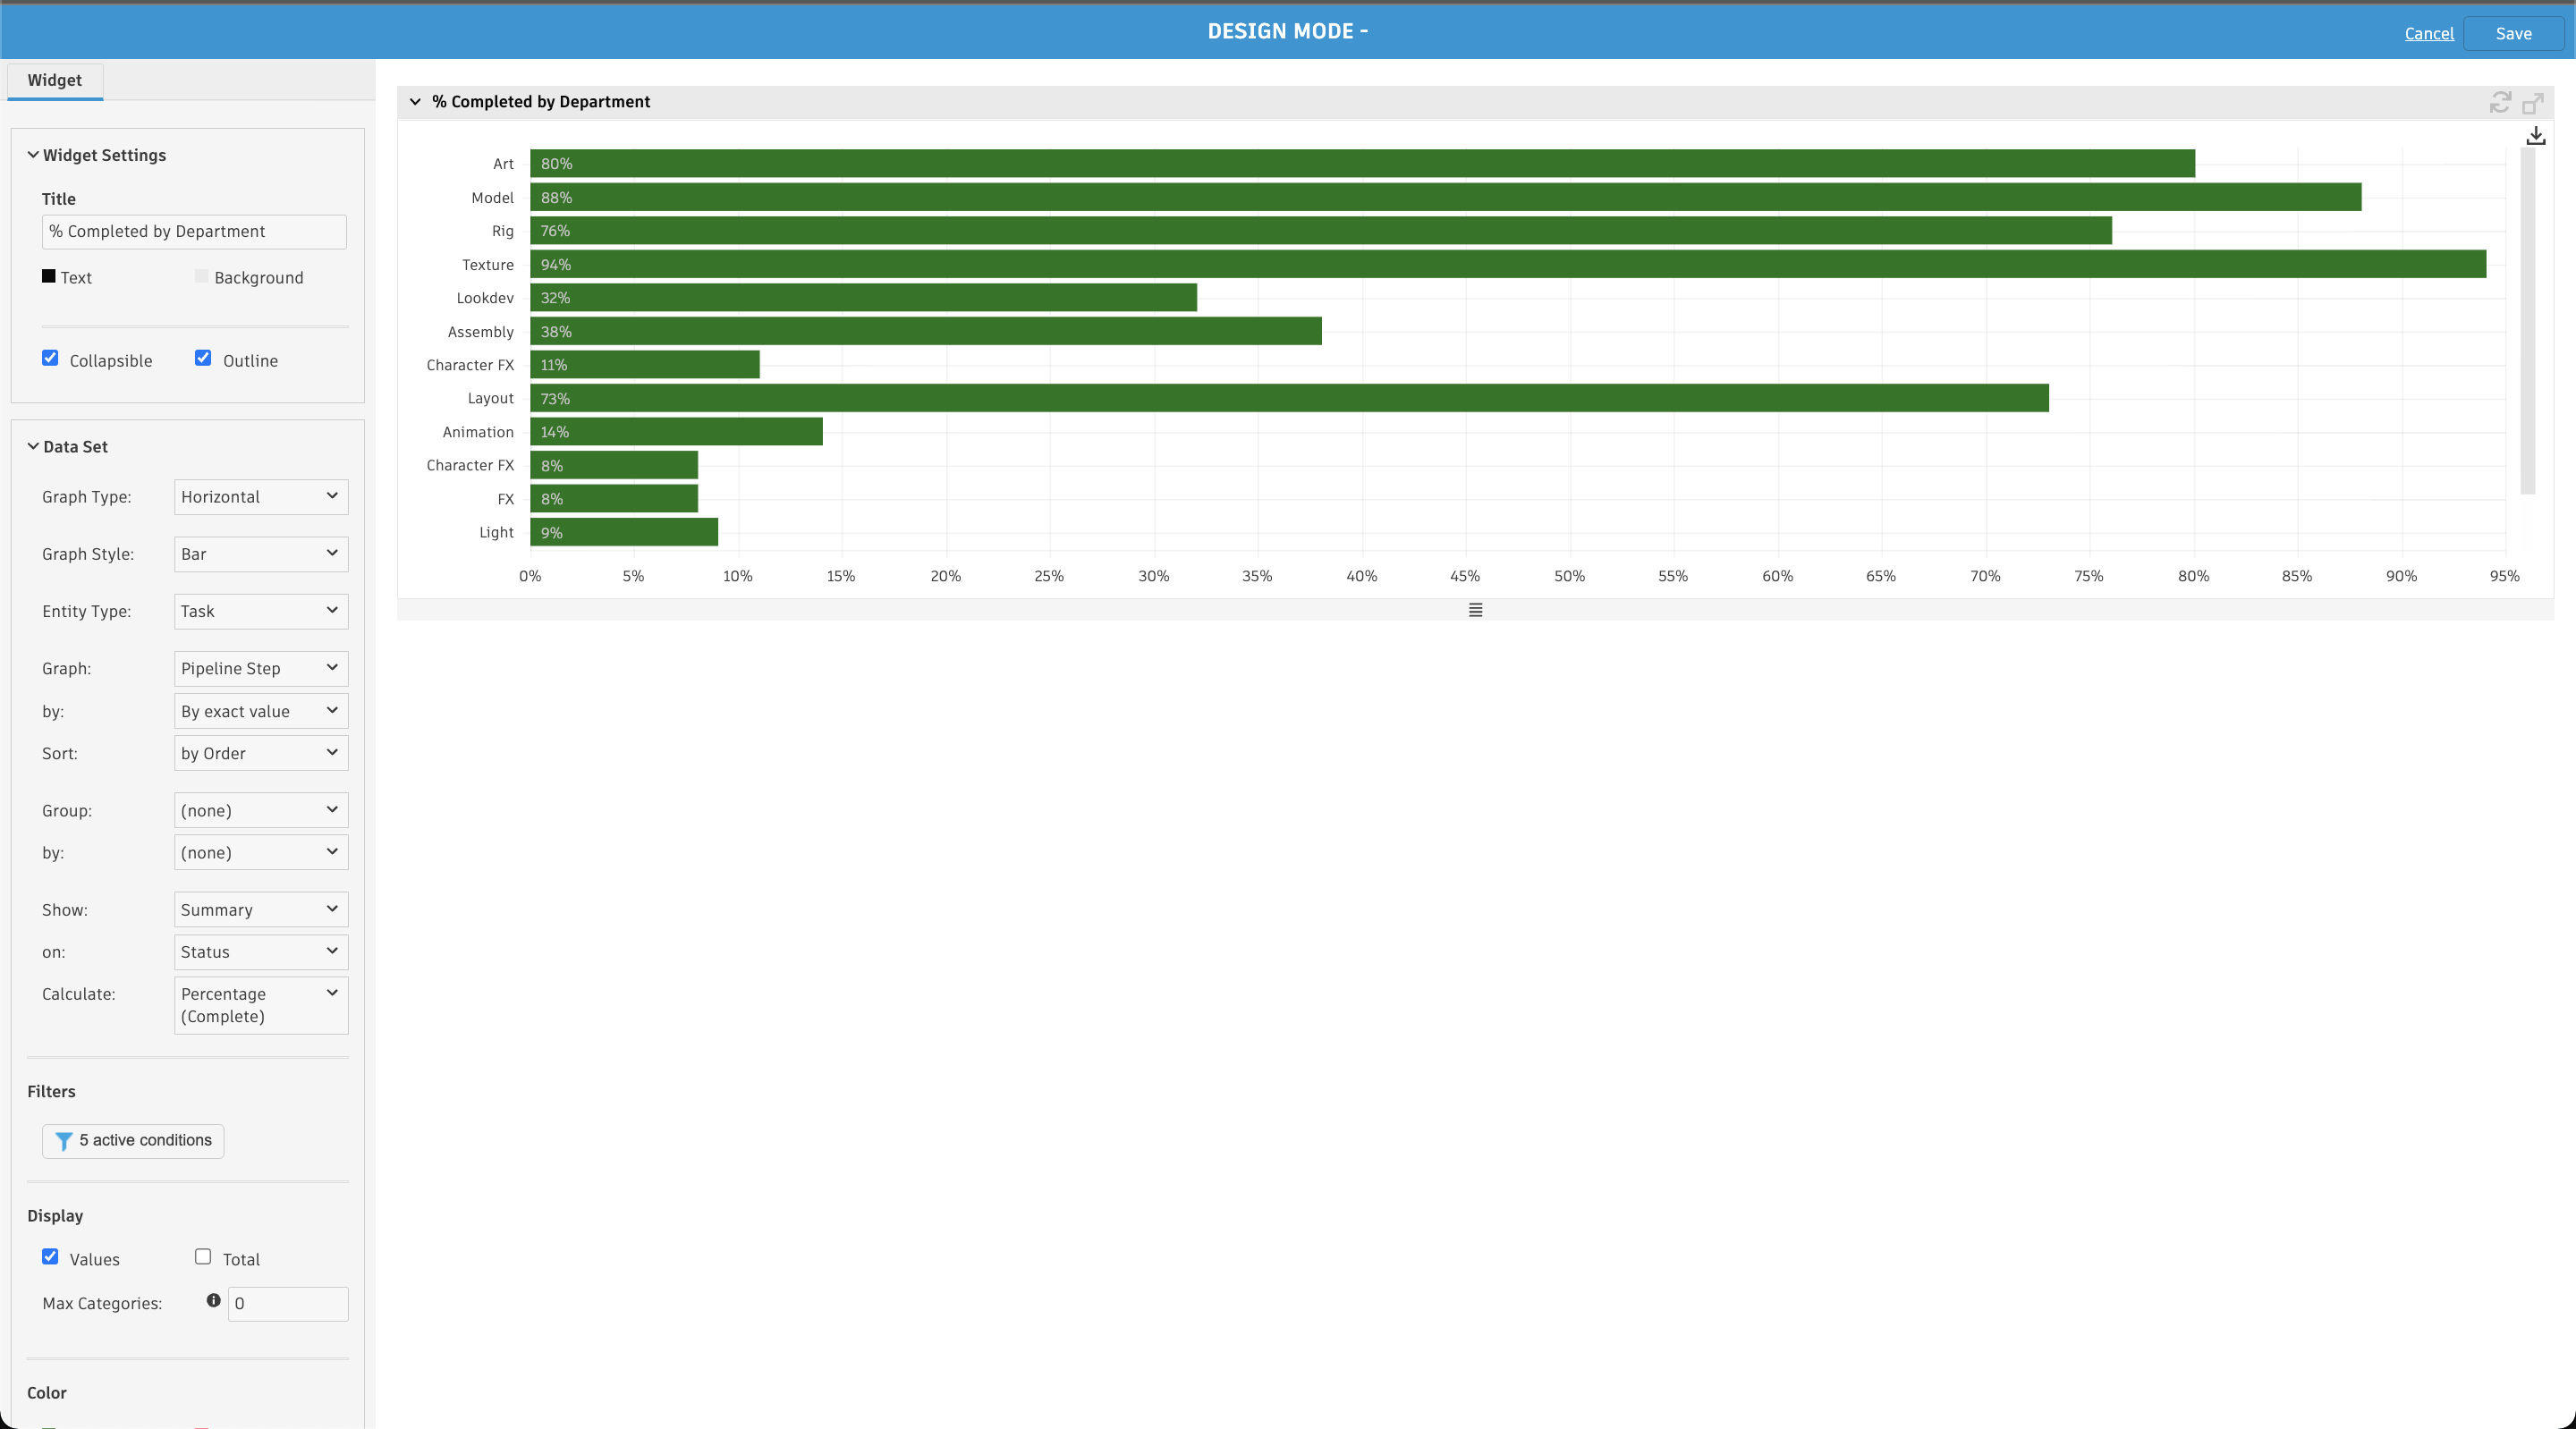
Step 6: Add a graph widget to the fourth column in the second row.
Configure your widget to show % Final by Department:
Configuring list pages
You can also create reports by configuring list pages in Flow Production Tracking. For example, you can create a “Shots due this week report” page to display Shots that are due that week by filtering on the end date for the final Task in the Pipeline. In this example the final Task is the Comp task.

To set up this report page:
- Create a new Project page with the Shot entity type. Make sure the Thumbnail, Status, Shot Code, Sequence, Pipeline Steps, and Asset columns are displayed.
- Set a filter to only show the Comp step that is due in the current week.
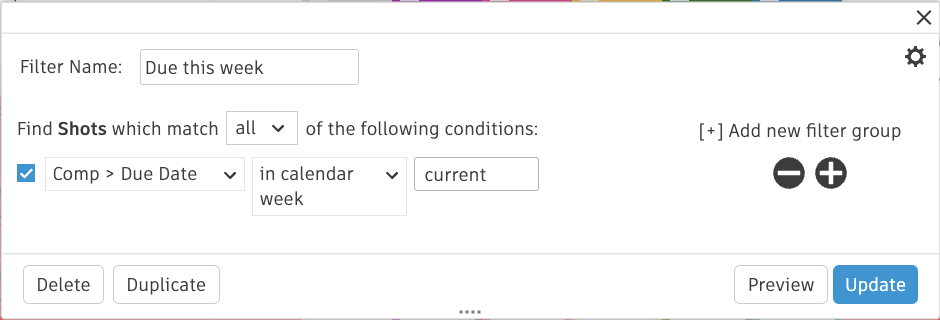
- Format all rows to easily see which shots are not yet finished. To do this, add a new page rule (this will only affect your report page).
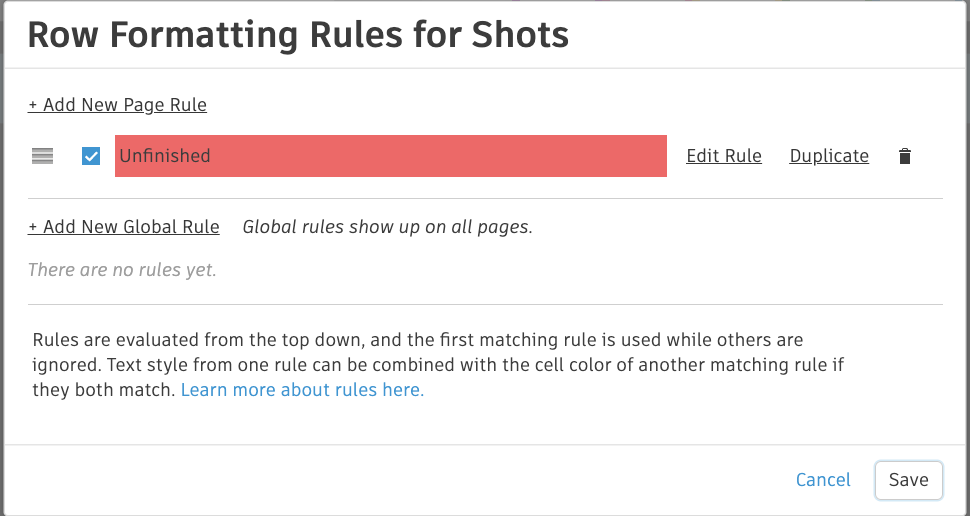
Name the rule “Unfinished” and set the filter to “Status is not final.” Then change the background color to red.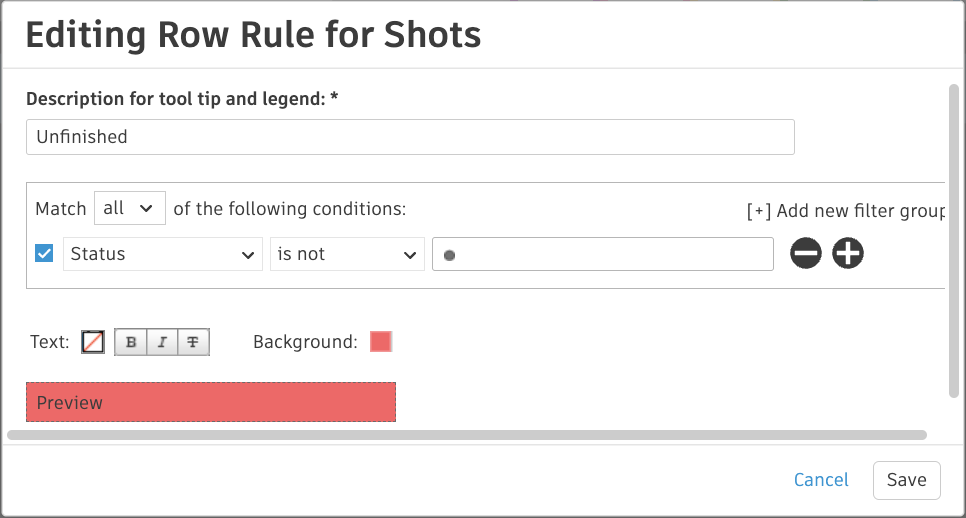
Your report page will now show all Shots that are due this week, and any Shots that are not yet final will be highlighted in red.
For more examples of reports you can set up, see our Graph widget tutorial.