AMP Use Case: Gears of War 3
This document serves as an example of how to use AMP to profile an application using the Scaleform SDK. An early build of Gears of War 3, produced by Epic Games, is used as the sample application.
The following figure shows a screenshot of the Gears of War main menu.

Figure 1: Gears of War 3
As a first pass, the main menu sequence was profiled at “low” profiling level and with detailed memory reports turned off. These are the default AMP selections, and they allow the developer to quickly identify any performance bottlenecks with minimum impact on the behavior of the application being profiled.
While profiling the application, the user progressed through a series of menus, and started a new game. Figure 2 shows the graphs displayed by AMP, where we observe that there is a definite spike in the advance time every time a new menu is loaded. From the memory graph, we observe that there is quite a bit of unused memory, which is undesirable because such memory is part of the GFx footprint, and therefore not available for use by other systems. We investigate both issues below.
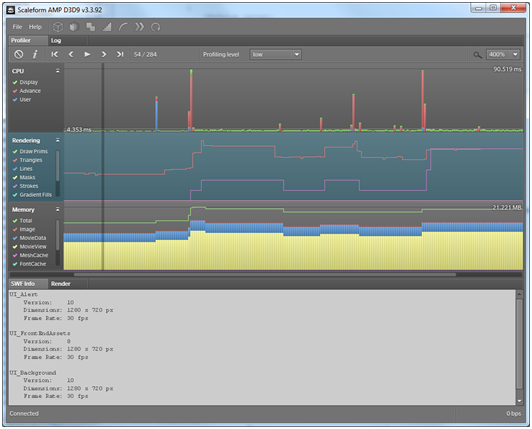
Figure 2: First profiling run on AMP
Repeating the profiling run at a high profiling level allows us to identify the functions that took up most of the spike time. The dropdown control shown in figure 3 can be used to set the profiling level. Figure 4 shows a portion of the function call tree for such a spike. We can see that most of the time spent in advancing UI_FrontEndAssets.swf was actually in an ExternalInterface callback to native code. Examining the ExternalInterface code reveals that the native code in UnrealEngine delegates the callback to UnrealScript. Even without examining the code further, we speculate that some of the performance hit in this case could have been avoided by moving the ExternalInterface callback from UnrealScript back to native code. With a bottleneck such as this spike, it is often worth taking every measure to avoid unnecessary performance hits.
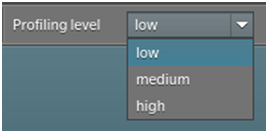
Figure 3: Setting the profiling level
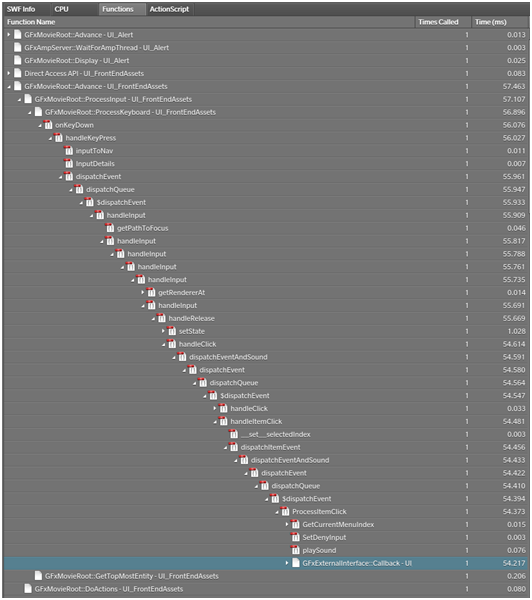
Figure 4: Function call tree for selecting difficulty level
To investigate the unused memory issue mentioned above, we repeated the profiling run with detailed memory reports toggled. To toggle detailed memory reports, us the ‘i’ button on the AMP client toolbar. The resulting memory report for a frame is shown in Figure 5, where we can immediately tell that Gears of War is using a paged allocator for GFx, since there are data listed in the “Page Map” and “Bookkeeping” categories. The unused space is mainly due to fragmentation, and is typically higher for this type of allocator compared to the new non-paged allocator available with Scaleform 3.3 and above.
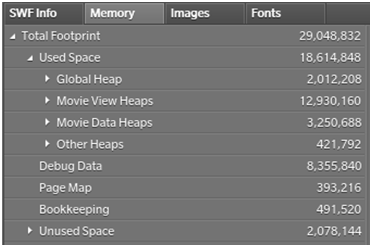
Figure 5: Detailed memory report (paged allocator)
The paged allocator is replaced with a non-paged allocator, and another profiling run is performed. The memory report for the same screen is shown in Figure 6.
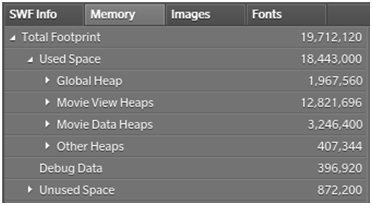
Figure 6: Detailed memory report (non-paged allocator)
We can see that the unused space was reduced by 58%, making the new allocator much less wasteful in this case.