AMP use case for MMO kit
This document serves as an example of how to use AMP to profile an application that uses the Scaleform SDK. The MMO kit is used as the sample application.
The following figure shows a screenshot of the MMO kit UI.
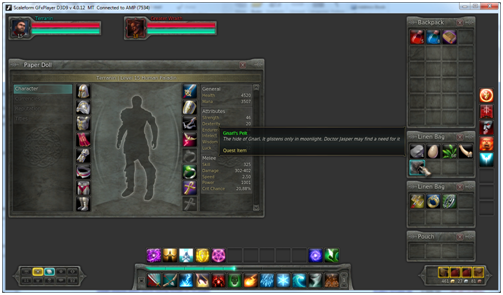
Figure 1: The MMO kit
As a first pass, the MMO kit was profiled at “low” profiling level and with detailed memory reports turned off. These are the default AMP selections, and they allow the developer to quickly identify any performance bottlenecks with minimum impact on the behavior of the application being profiled. While profiling the application, the user clicked to successively open six inventory windows. Figure 2 shows the graphs displayed by AMP, where we observe that there is a definite spike in the advance time every time a window is opened. We may also see that as the windows were opened, the load on the renderer steadily increased, as evidenced by the increase in meshes, draw primitives, and triangles. As expected (see Figure 3), this increase in GPU demands had an effect on display time, especially after the first window was opened. Figure 3 shows that the text in that first window (Paper Doll) resulted in a number of font cache misses and an increase of the rasterized glyphs in the font cache. Clearly, that is a point in the profiling run that warrants closer investigation with more data gathered by AMP.
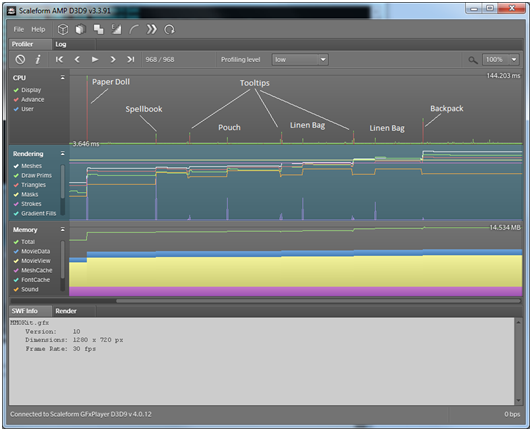
Figure 2: First profiling run on AMP
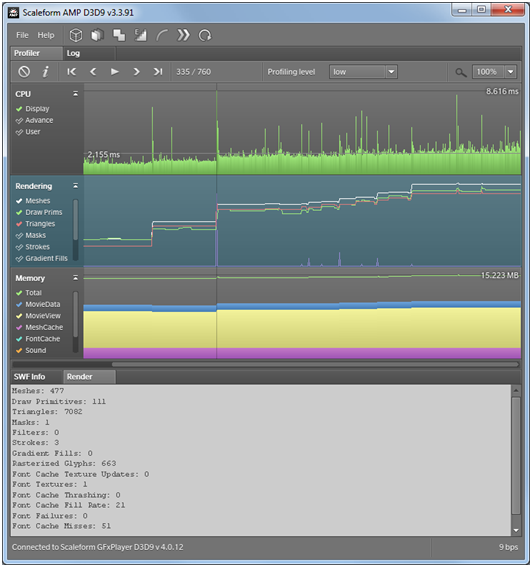
Figure 3: Display time and rendering statistics
For the remainder of this use case, we focus our attention on the frames near the opening of the “Paper Doll” window, identify the cause of the slowdown, and we will propose improvements that would result in enhanced performance.
A second run was performed, with detailed memory reports toggled, and with “medium” profiling level. The elevated profiling level has a higher impact on performance, but it allows us to profile ActionScript function calls. The profiling level may be changed by using the appropriate dropdown control at the top-center of the AMP client UI, as can be seen in figure 3. The top ActionScript function timings, sorted by total time taken to execute for the selected frame, are shown in figure 4.
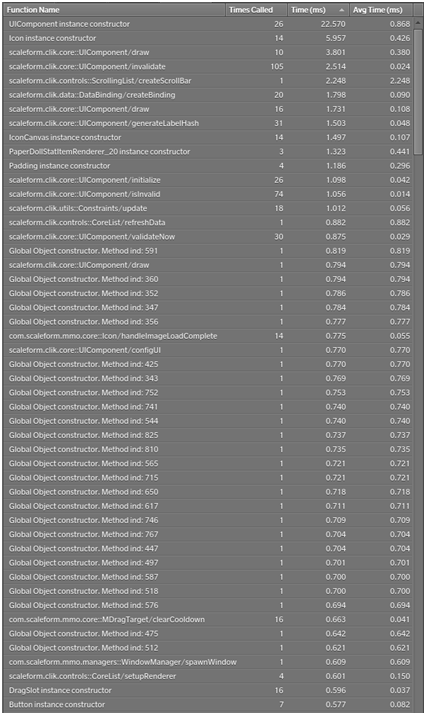
Figure 4: ActionScript function times
We make the observation that a large part of the advance time is spent executing the UIComponent instance constructor. This behavior occurs every time the user opens the Paper Doll window. An easy optimization to address this issue could be to pre-construct and cache the window as the application is loading, so that it does cause frame-rate drops on opening the window.
Having found a culprit for the performance drop in ActionScript advance, we now turn to the rendering thread, where there is also a spike in display time. The rendering graph of Figure 3 shows that there is a spike in font cache misses. This was expected, and occurs because the new window has new glyphs that need to be inserted in the cache. It is a one-time hit.
Expanding the rendering call graph for the selected frame reveals that the spike in display time is not due to glyph rasterization, as we may have guessed by looking at Figure 3, but was mainly due to registering the pixel and vertex shaders (Figure 5). Unlike the ActionScript UIComponent constructor calls, above, this is a one-time performance hit. However, similarly to the ActionScript constructor calls, it could be moved to load-time to improve performance during the first opening of the window. To do shader compilation up-front rather than on demand, the developer may remove the HAL configuration flag HALConfig_DynamicShaderCompile.
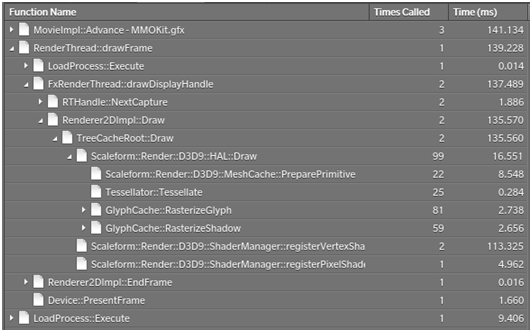
Figure 5: Function call graph