High rendering use
Graphics performance issues are notoriously difficult to track down in applications. AMP provides extensive statistics about the assets being rendered using Scaleform. The example below demonstrates how to use AMP to track rendering performance related issues that can occur through excessive draw calls and high triangle counts.
The file High_Rendering_Use.swf under the UseCases directory simulates a low rendering performance scenario. Profiling this file in AMP reveals the rendering bottlenecks. Figure 9 displays the profiler output for this example SWF file.
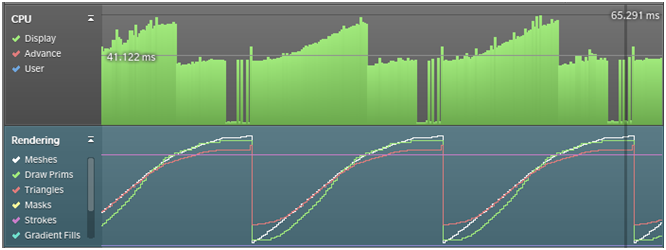
Figure 9: High Rendering
The Render Summary for the selected frames in Figure 10 shows a high number of triangles being drawn as well as many strokes. Another metric to note is the high Mesh Thrashing value which indicates a high tessellation frequency and points to a SWF that contains a very high vector shape count.
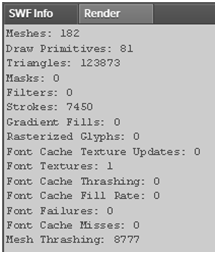
Figure 10: Render Summary