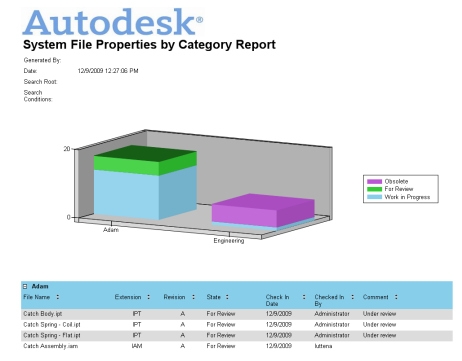
The reporting feature, when used in conjunction with data mapping, lets you map report data to the canvas for visual overview of a model's status and development. This information makes it easier to track designs and projects throughout their lifecycles. You can generate reports of model data based on any of the templates supplied with the client. The report feature is accessed from the Data Mapping dialog.
Release Availability
This feature is available in certain editions of Autodesk Vault. Refer to the table below to see if your edition has this feature.
| 2012 | 2013 | 2014 | |
|---|---|---|---|
| Autodesk Vault Basic |

|
||
| Autodesk Vault Workgroup |

|

|

|
| Autodesk Vault Collaboration |

|

|

|
| Autodesk Vault Professional |

|

|

|
Report Templates
Report templates are provided with the Autodesk Vault client. These report templates contain a color palette for a chart, but the templates do not specify which color is assigned to which chart element. You can specify how chart elements are color coded when you use the data mapping feature. Color coding chart elements allows quick, repeatable viewing of model data.
You can assign standard color mapping on the Assign Color dialog in the Autodesk Vault client. Access the dialog by selecting Tools ►Administration ►Vault Settings. Select the Behaviors tab and then click Define under Report Management.

Report Charts
The report feature can display data in four different charts:
- Pie chart
- Doughnut chart
- Column chart
- Stacked column chart
Generate a Report of Mapped Data
- Enable report control by clicking Map Data on the Autodesk Vault ribbon.
The Map Report Data dialog displays.
- In the Map Report Data dialog, select a report template from the drop-down list, or open a new template from a local folder or the vault.
- Click the Generate Report icon.
A progress bar displays with the status of the report. Depending on the size of your model, this process can take a few minutes. You can continue to work while the report is being generated.
Once the report has been generated, the report chart is displayed within the data mapping control.
- Click the View Full Report icon to display the full report.

Related Topics