
Diagnose and debug graphs
As you work with complex graphs, you are likely to run into problems that require diagnosis and debugging. There are some basic tools that can help with this task.
Diagnostic node colors
Nodes with problems are highlighted in different colors. If the highlighted node is a compound, enter it to see which of its internal nodes have problems.
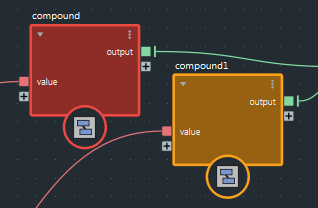
- Nodes that have errors are highlighted in red. Errors mean that the graph cannot be compiled and executed.
- Nodes that have warnings are highlighted in orange. Warnings mean that there are problems, but the graph can still be compiled and executed.
Hover the pointer over a node to see the full message in the Info Bar.
Watchpoints
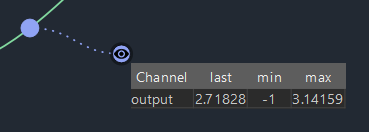
Watchpoints let you see information about the values flowing along connections.
To add a watchpoint, right-click on a connection and choose Set Watchpoint. You can hide or display the data by clicking the eye icon.
You can detach a watchpoint from its connection wire by dragging its eye icon or the table header anywhere in the graph view. The table is joined to the wire to show which data is dispayed.
To return the watchpoint to the wire, double-click the eye icon. You can also remove the watchpoint itself by Alt+Shift+dragging across the dotted line. Alternatively, right-click the eye icon and choose an option.
After adding a watchpoint, it is empty until the graph gets executed again. You can force a graph to be executed by changing an input, or advancing a frame in the case of a simulation.
Watchpoints update only when data flows through the connection. Watchpoints are not updated if they are on connections that do not lead to a graph output, or if they are not evaluated because of an if node.
The information shown by a watchpoint depends on the type of data:
- For single values, watchpoints show the value of the last execution, as well as the minimum and maximum values encountered in the current session.
- For arrays, watchpoints show the array size as well as the minimum and maximum values of the last execution.
- For objects, watchpoints show information about the properties that have been defined.
You can use the Edit > Watchpoints menu to remove, pause, or resume all watchpoints at any level of the graph.
Watchpoints do not update when cached playback is in use in Maya.
Data browsers
Data browsers provide more detailed information about the values flowing along a connection than watchpoints do. They can even show the individual values of properties of an object contained in an array.
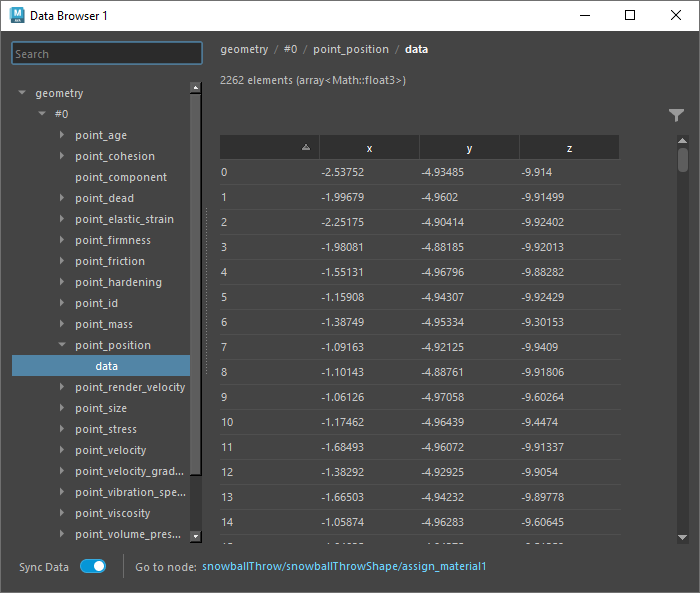
To view values in a data browser:
Right-click on a connection or existing watchpoint and choose Open in Data Browser. If one or more data browsers are already open, you can open the data in a new data browser or re-use an existing one.
Note that this creates a watchpoint if wasn't already one on the connection.
Use the left pane to select the data to view in the right pane. If desired, you can:
- Ctrl-click to toggle-select multiple items to compare data side by side.
- Drag or shift-click to select a contiguous range of items.
When looking at array values, you can click a column header to sort in ascending order, and click a second time to sort in descending order.
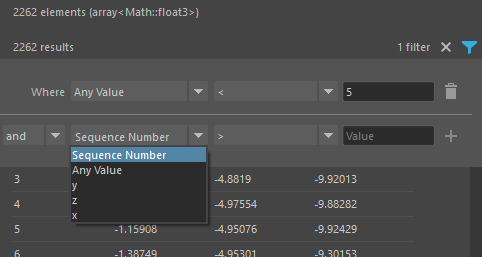
If you want to filter the displayed values, for example, to show only values in a certain range, then click the Filter icon and set one or more conditions:
- Enter the desired options and then click +. Repeat for additional conditions.
- Sequence Number is the index for values in an array.
- For multi-component items like vectors, you can select a specific component or choose Any Value.
- Click the corresponding trash can to remove a single condition, or click X to remove all conditions.
If you do not need to see updated values as you work in the graph, you can speed up interaction by turning off Sync Data. Simply turn it back on when you need to see the current values again.
The data browser window can be dragged and docked to any suitable location in the workspace.
Dump object data to a text file
When the information in the data browser is too much to search or scan, you can output an object's information to a text file.
- Add a
dump_objectnode to the graph. - Specify the
filename. - Set
sample_sizeto the maximum number of items to include from arrays. This prevents huge files from large objects. - Connect the object that you want to output to text to the
objectinput. - Connect the
out_objectoutput as an output of the graph. Typically, you can simply replace the original connection from the upstream node.
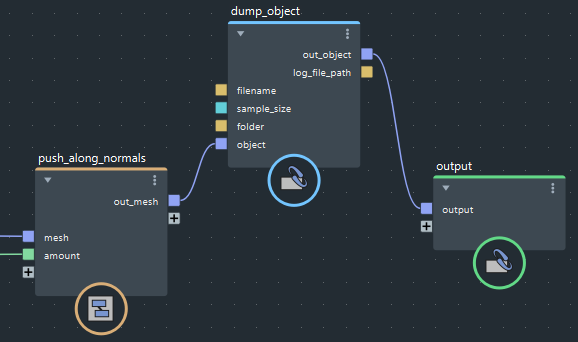
At least one output of the dump_object must lead to a graph output, or else the node does not get executed.