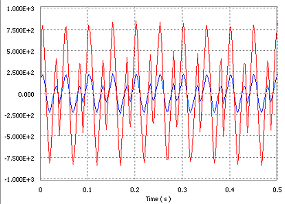
The Output Grapher is the means to examine a variety of results from the simulation. The following list describes some of the things you can do after running a simulation:
- Change reference frames to view results in various coordinate systems.
- Display curve results.
- Save the simulation results for later review and comparison.
- Display results in terms of time or other criteria.
- After running the simulation, but before leaving the run environment, on the ribbon click
Dynamic Simulation tab
 Results panel
 Output Grapher
 .
. The Output Grapher is divided into different sections: browser, graph, and time steps. Commands specific to Output Grapher are located on a toolbar across the top of the window. The window is resizable, so adjust it to meet your needs.
- In the browser of the Dynamic Simulation - Output Grapher window, expand the Standard Joints node. Then, expand the Revolution:2 node.
- Under the Revolution:2 node, expand the Driving force node. Check the box next to U_imposed[1]. You will see the force displayed in the graph region.
- Expand the Prismatic:3 node.
- Expand the Velocities node, and check V[1]. The velocity is presented in the graph with the driving force.

- Close the Output Grapher window.