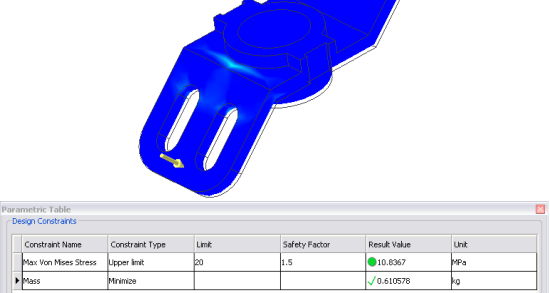
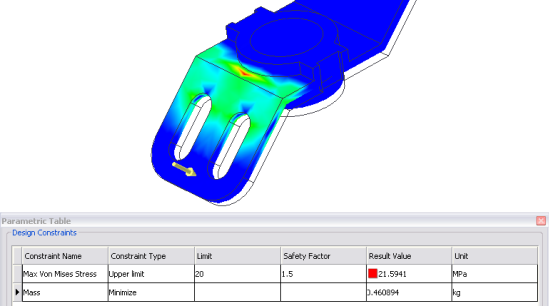
To view the results for different parametric values, move the sliders on the Parametric Table. If the results of the simulations are ready for evaluation, you can display a chart for the results of each parameter or parameter change.

Optimize and filter results by setting limits on some constraint values and minimizing others. In the Parametric Table, Design Constraints section, set the status of a constraint to a type of limit. Specify the value and safety factor of the limit. Then change the status of another constraint to Minimize. The configuration updates and displays a result with the minimized values. If there is an existing configuration that meets all the limits, it displays. Otherwise, the result violates a constraint.

When an optimized solution displays, you can still move the sliders. The constraint values display a green check mark for the optimized constraint. For limit constraints with a safety factor, a colored shape displays to indicate if the constraint was exceeded. A green circle indicates the value lies within the acceptable range and a red square indicates the value lies outside of the acceptable range.
