The Simulation browser Results node is populated with the simulation results.
However, we use the Parametric Table and the visualization capabilities to assess the design and optimize for mass.
- On the ribbon bar, Manage panel, click Parametric Table.
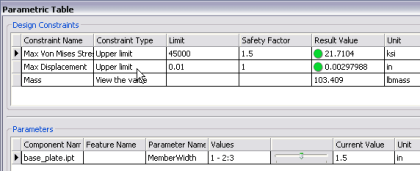
- In the Parametric Table, note the presence of a green circle in two Result Value cells. A green circle indicates that the Result Value is within the associated safety factors.

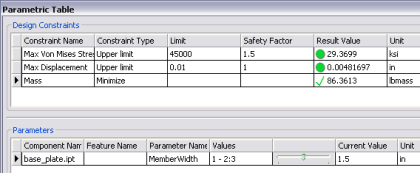
- Change the Mass Constraint Type to Minimize.
The parametric values change to show the configuration with the least mass that meets the given constraints. In this case, the original profile width value was 2 inches. The optimized configuration is 1.5 inches, which reduces the mass.
 Note: If you move the slider to show a current value of 1.0, the table updates and you see that maximum displacement exceeds the safety factor criteria. A red square, next to the Result Value, denotes the condition.