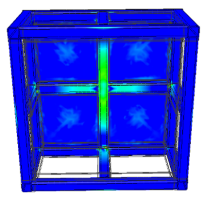
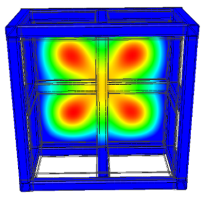
View 3D and XY plots to understand the behavior of the model under the defined boundary conditions.
After running a simulation, you can perform post-processing tasks using the assorted commands in the Display panel. You can choose shading options, display minimum and maximum labels, insert probes, and so on.
The Results node, in the Simulation browser, is populated with the simulation results based on the criteria you specified. The Von Mises Stress result (default) is displayed as a 3D color plot.
In this example, because of the connections between profile geometry, stress concentrations are expected at the joints. To see the stress distribution farther away from the concentrations, change the Color Bar settings.
- On the ribbon bar, Display panel, click Color Bar.

- In the dialog box, uncheck Maximum.
- Enter 5 in the edit field above the check box. Click Apply.
- Use the view commands to rotate the model so you can see the underside of the assembly. Note how the stress is distributed in the members.

To view other results such as Displacement, double-click the appropriate browser node to update the display.

For simulations involving parametric dimensions, move the slider to various parameter values to display the associated results.