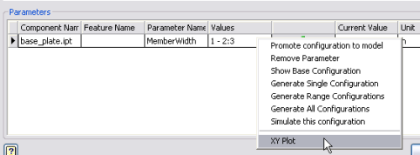
XY plots show a result component over the range of a parameter. To view an XY plot, right-click the parameter row and select XY Plot.

The XY plot displays the Displacement results versus the parametric configurations. Hover the cursor over a plot point to display the displacement value at that point.
