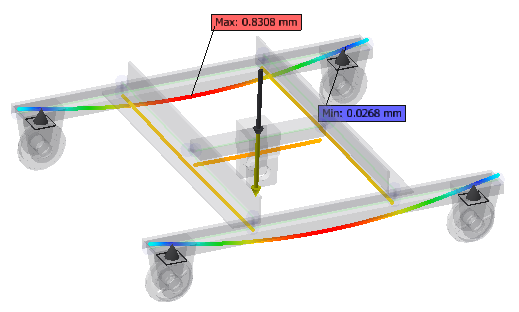
Minimum and maximum values quickly show the locations of load extremes.
In the Display panel, click Max Value![]() . In the graphics window, a label with a leader points to the location of the maximum value.
. In the graphics window, a label with a leader points to the location of the maximum value.
In the Display panel, click Min Value![]() . In the graphics window, a label with a leader points to the location of the minimum value.
. In the graphics window, a label with a leader points to the location of the minimum value.
Note: You can drag the labels to different locations.
The following image shows maximum and minimum values for the Displacement results plot.

Cancel the selection of the Max Value and Mix Value options in the Display panel to hide the values.