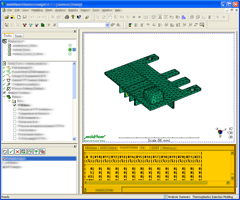
After an analysis has been run, the Logs pane is displayed at the bottom of the Model pane.
Logs Pane
The results of an analysis can be represented in several ways. You have already vied the graphical representation of Fill time and high Aspect Ratios . The numerical values of the available results are also of interest. An analysis overview is presented in the Logs pane.
The Logs pane can be hidden or displayed at any time by ticking the Logs box in the Study Tasks pane.
Ensure the model from the previous task is open. Alternatively, select tutorial_model from the Getting Started project.
- Select the Tasks tab from the top of the Project panel.
- Select the Logs box in the Study Tasks pane.
- Select the Analysis Log tab from the top of the Logspane.
- Scroll up and down the screen to view the output results.
Finally, you can generate customized reports that outline specific combinations of features required. This will be addressed in the Post-Processing tutorial.
Click the Next topic link below to move on to the next task of the tutorial.