In this task you will create and edit XY plots.
In this task, you will learn how to:
- Create an XY plot.
- Add a curve to the plot.
- Create a plot path representation of a result.
- Investigate the pressure through the mold.
If you have the model from the previous task open, skip the next three steps.
- Click
 .
. - Open the Postprocessing project you created in the first task of this tutorial.
- Double-click cpu_base in the Project View pane to open the study.
- Right-click New Triangles in the Layers panel and select Hide All Other Layers .
- Enter the values 165 25 -20 in the
 Rotation Angle text box , and press Enter to rotate the model.
 - Click
 , and select Plots from the drop-down menu.
The Create New Plot dialog, which provides a list of results available in this study, appears.
- Scroll down the Available results and select Pressure .
- Select
XY Plot
in the Plot type area, and click OK.
A set of axes are displayed with the model displayed in outline. The cursor has changed to cross-hairs, with XY in the corner. At this stage, there are no pressure plots displayed in the graph. We need to select the points where the pressure is of interest.
- Click the cursor on the points illustrated below.
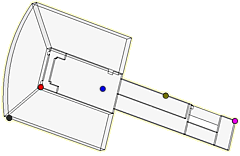
The pressure data for each selected node is automatically displayed on the XY plot in the form of a curve.
- Click
 .
.
Notice in the Curves area that all of the curves you added to the plot are listed, and are identified by their node number.
- Click the XY Plot Properties (2) tab and in the X Range area, select Manual.
- Set the minimum value to 0 and the maximum value to 30.
- Click Manual in the Y Range area, and set the minimum to 0 and the maximum to 70.
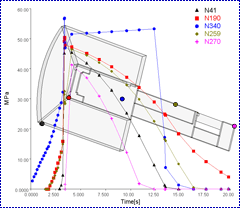
- In the Plot title box, change the title to CPU Base - Pressure:XY Plot.
- Click OK.
Study the XY plot that you have just updated.
- Click . Select the XY Plot Properties (2) tab, and select the Auto option in both the X and Y range box.
- Select the Mesh Display tab and change the Surface display to Transparent with an Opacity of 0.5.
- Click OK to view the results.
- Select
 .
. - Click a plot point to determine the values represented.
These results can also be saved as a text file that lists, for each node selected, the time/pressure values that are graphed.
- Select
 ().
(). - The Save As dialog appears. You can select the location on your hard drive to save the text file. For this example, in Windows XP, select
My Documents
from the Save in drop-down list.
Note: In Windows Vista, select Documents from the Save in drop-down list.
- Enter XY plot data in the File name box, and click Save.
- In Windows XP, use Windows Explorer to navigate to
My Documents
. Open the file, and study the contents.
Note: In Windows Vista, navigate to your Documents folder, open a file and study the contents.Tip: You can also save the XY plot data in XML format using
 , or in Patran format using
  .
. - You can also view the pressure through the mold at individual times. Click and select
Pressure
from the Available results list.
- Select Path plot from the Plot type box and select OK.
- Choose the same points as previously selected.
The points on the graph represent the pressure at the nodes along the pathway at the specified time.
- From the Animation panel , click
 Play.
Play.
The pressure through the mold is animated. An individual result can be viewed by clicking the
 Step Backward and
  Step Forward icons.
Click the Next topic link below to move on to the next task of the tutorial.