In this step, we use the Critical Values component of the Decision Center to compare outlet flow rates from the two designs.
In the Decision Center, right click on Critical Values, and click Update critical values.

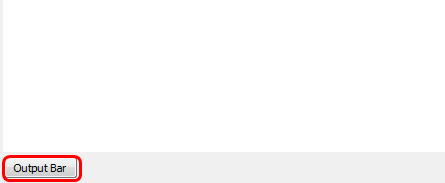
If the Output bar is not visible, click Output bar to expand it:

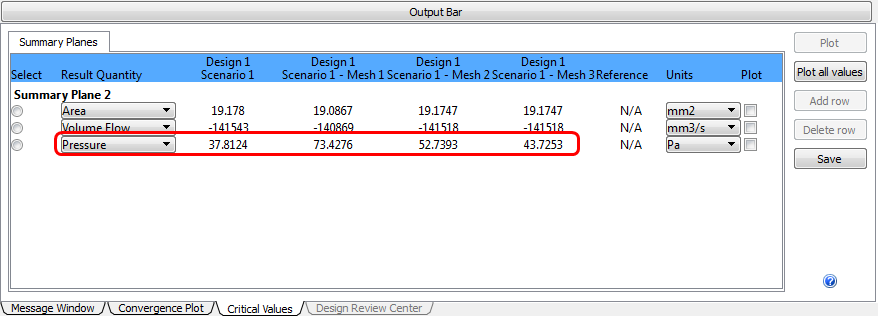
Note: View the Summary Plane data on the Critical Values tab of the Output Bar.

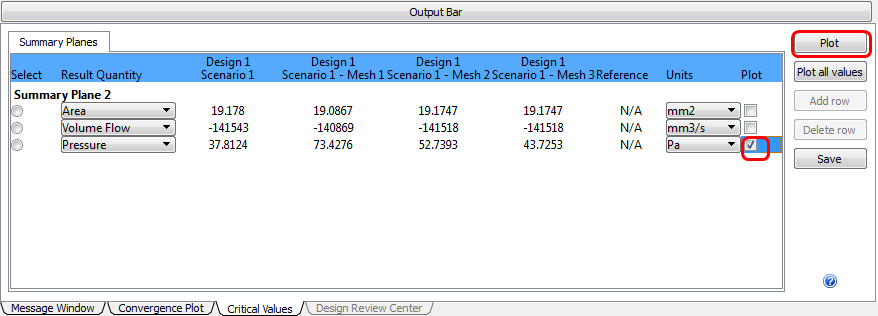
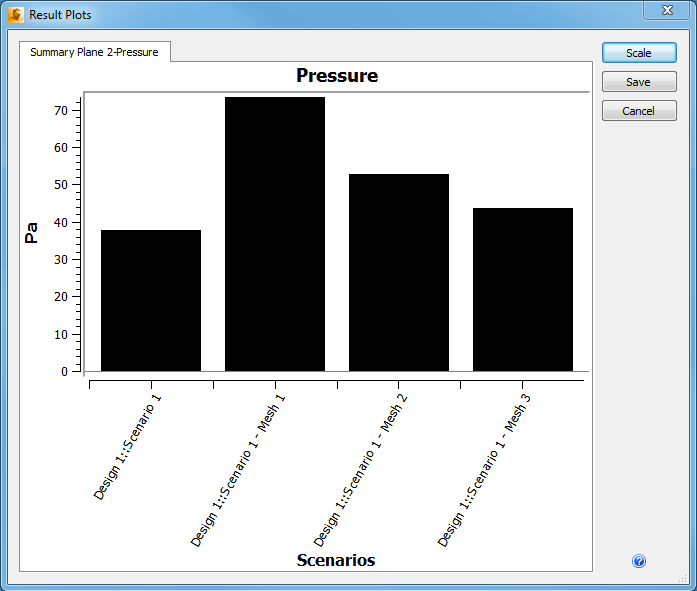
To plot the pressure from the four meshes, check the Pressure Plot box. Click the Plot button:


Note: Note how the pressure drop steadily decreases with each mesh refinement. The difference between Step 3 and the final mesh is much smaller than between Steps 1 and 2. This clearly shows that the pressure drop is changing less with each mesh refinement, leading toward a mesh-independent solution.
For more about Critical Values
Congratulations! You have completed the exercise. Click here to return to the Tutorials Title Page.