Previous: Exercise 13 | Next: Exercise 14
The Decision Center is a simple yet powerful environment for comparing design alternatives. Use it to identify the design that satisfies your design objectives.
It is a powerful tool for:
- Extracting specific results values
- Comparing results from multiple scenarios
Visualization objects such as Results Parts, Results Planes, Result Points, and XY-plots form the basis of the Decision Center. Create an object on one Scenario, designate it as a "Summary" object, and the Decision Center computes the results on every scenario in the Study.
To open the Decision Center, click Results (tab) > Compare (panel) > Decision Center. The Decision Center appears in the lower half of the Design Study bar.
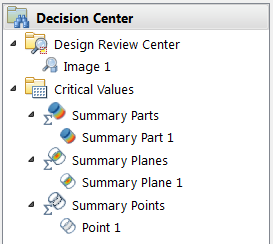
Use the Decision Center to manage all summary items:

There are three principal components of the Decision Center:
Visual
Use the Design Review Center to compare results from multiple scenarios visually. It is a powerful tool for comparing flow and thermal performance of two or more scenarios in a design study.
To compare visual data across multiple scenarios, create a view, right click, and select Capture summary image.
Tabular
Use Critical Values for comparing results from individual and multiple scenarios.
There are three types of Critical Values Entities. Each is based on a different Summary Entity type. Each answers questions such as "What is the maximum temperature?", "Which design produces the lowest pressure drop?", "Does the velocity at a point near a critical component exceed a design limit?"
Graphical
Compare results by overlaying XY Plot data from multiple scenarios on a single plot.
Use Summary Plots to answer questions like: "How does the pressure vary across the flow channel as the design is changed?" and "How does the temperature gradient respond as the design is modified?"
Mapping Decision Center Data across the Design Study
Use the Decision Center to compare key performance criteria and images from scenarios within a design study.
Items stored in the Decision Center are mapped across all Scenarios in a design study.
- To ensure an item is current, right click on it and select Update. Items that are out of sync with the current results are marked with a warning symbol, and need to be updated:

- To update all items in the Decision Center, right click on the Decision Center bar and select Update All.