In this step, we will use the summary plane and summary plot created in earlier steps to compare the performance of the two scenarios.
To start comparing results, click Decision Center in the Quick Access toolbar:

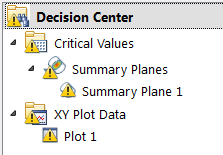
The Decision Center should list the Summary Plane and the Summary Plot. Both will have the "warning" icon. This means that the Critical Values must be updated before we can assess results:

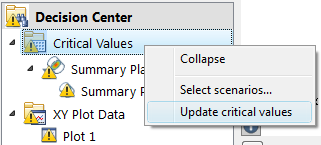
In the Decision Center, right click on Critical Values, and click Update critical values.

To compare the pressure drop in the two scenarios, click the Critical Values tab, and then the Summary Planes tab:

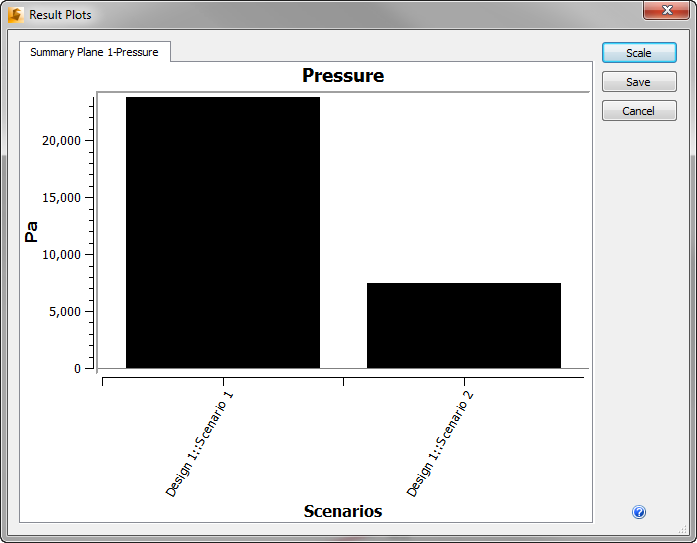
To plot the values, check the Plot box for Pressure, and click the Plot button.

