Given the nature of a faucet, it is important that the water at the outlet have as uniform a temperature distribution as possible.
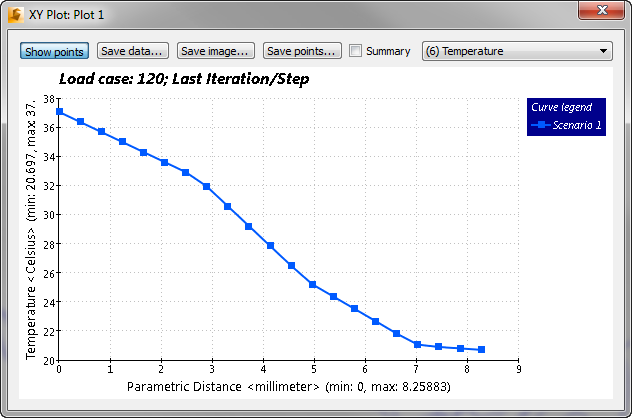
A large temperature gradient can be very unpleasant for the user and can lead to burns from scalding hot water. In this step, we will create an XY plot of temperature across the outlet. This provides a very obvious, graphical way to assess the outlet temperature variation.
Right click on the plane, and select Shaded.
To display a temperature results plane, select Temperature from the Result menu on the Planes context panel.

Left click on the plane, and click the Surface Align icon. Select the outlet surface.


Right click on the plane, and select XY plot.
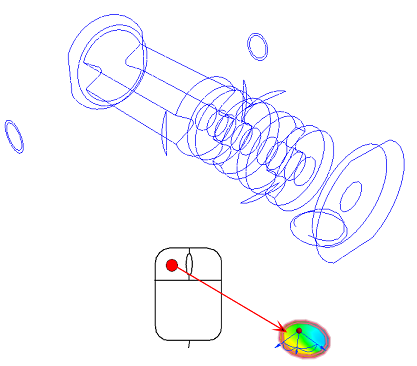
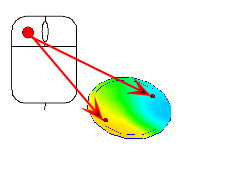
Click Add by picking. Click Add points, and select two points on either side of the plane:

Click the Plot button.

Click Summary at the top of the plot dialog.