Previous: Chapter 12 | Next: Chapter 13
This exercise teaches how to determine if the results from a completed analysis are ready to be assessed.
1. In the Output Bar, click on the Convergence Plot tab.
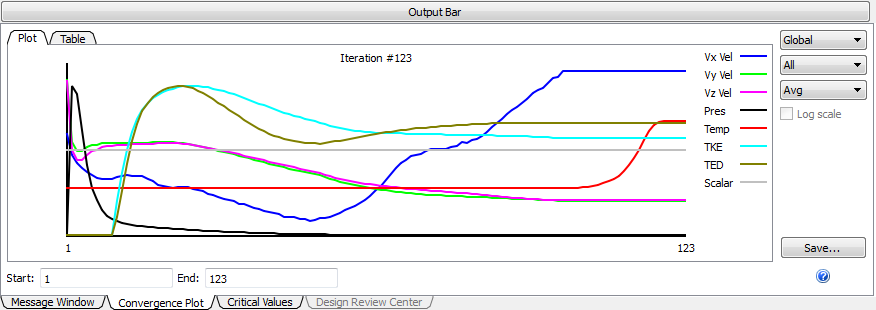
2. To determine if thermal convergence was attained, check the number of iterations. If it is less than 350 (the sum of the specified flow and maximum thermal iterations) then thermal convergence was attained, and the analysis automatically stopped.
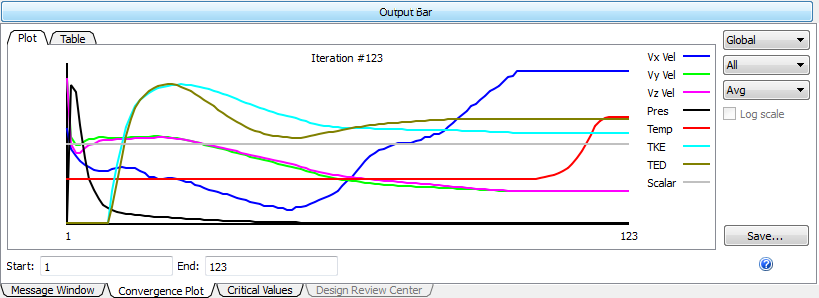
3. To view the Temperature convergence plot, select Temperature from the results menu:

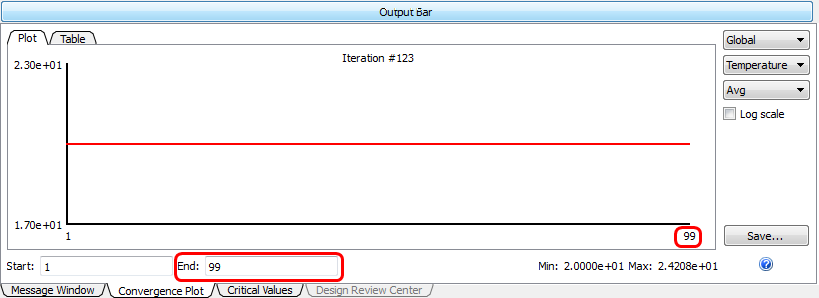
4. To determine if the flow solution converged before iteration 100, check for variations in the Temperature prior to iteration 100. Change the End: field to 99 and press the Enter key.
5. To examine the stability of the flow solution, check the pressure and velocity in the Z direction (primary flow direction) by selecting Pressure and then Vz from the results menu.
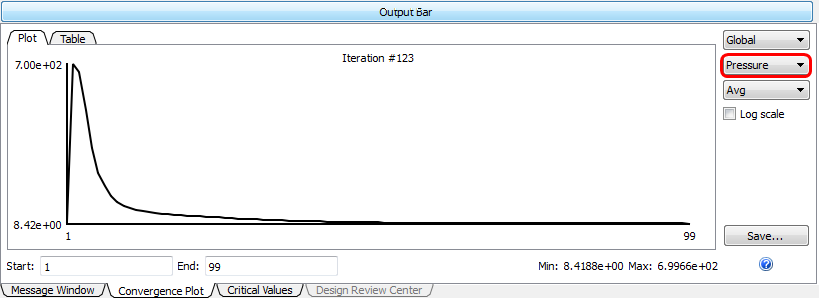
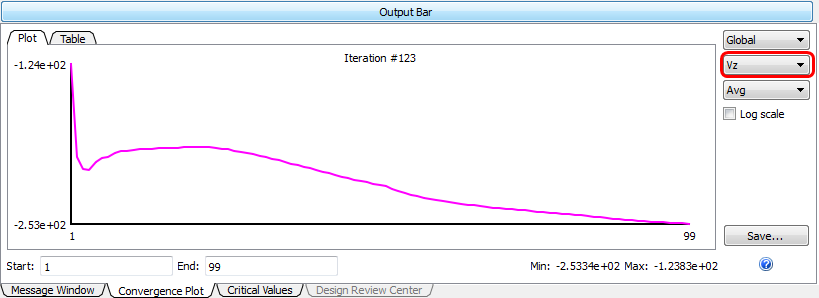
Conclusion: Pressure fluctuations are minimal and primary flow variations are nearly flat, so flow convergence is adequate for studying trends.
End of Exercise