In this step, we'll apply the Summary Images that we've captured for the Summer Scenario to the Winter Scenario, and start comparing the two design days.
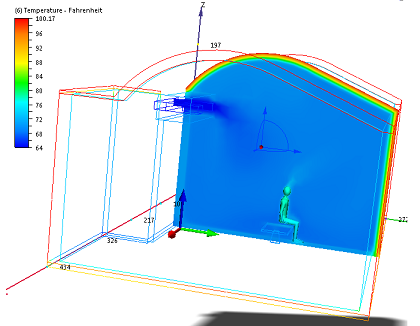
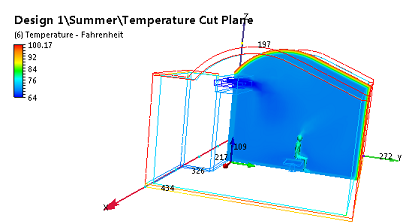
Note: For reference, this is the temperature cut plane from the Summer scenario:
1. Click the Decision Center icon on the Quick Access toolbar.

Note: To help keep the Summary Images clear, we'll first rename them with more descriptive names.
2. Rename Image 1:
- a. Right click on Image 1, and click Rename.
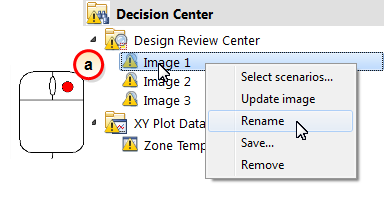
- b. Enter Temperature Cut Plane.
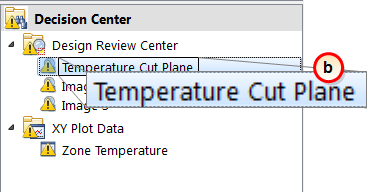
3. Rename Image 2:
- Right click on Image 2, and click Rename.
- Enter Temperature-Flow Iso Surface.
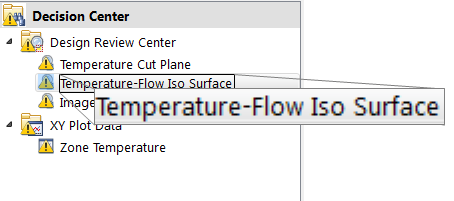
4. Rename Image 3:
- Right click on Image 3, and click Rename.
- Enter Predicted Mean Vote.
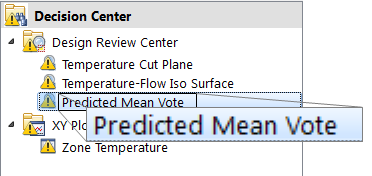
Note: We are now ready to update the three summary images and the summary plot with the Winter scenario results...
5. Right click on the Decision Center banner, and click Update all.
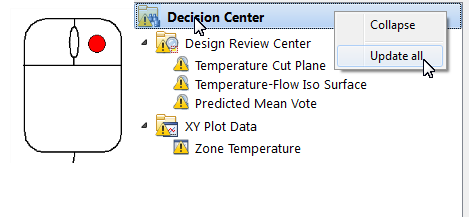
6. In the Decision Center, activate the Temperature Cut Plane Summary Image:
- a. Left click on Temperature Cut Plane.
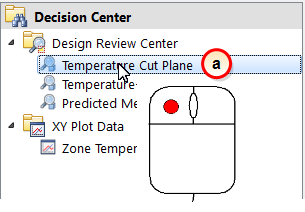
Note: You should see the temperature Summary Image from the Summer scenario.
- b. If the image is zoomed way in, click View (tab) > Navigate (panel) > Zoom > Zoom all to zoom back out. (Or just roll the scroll wheel on the mouse).

4. Drag the image from Winter into the Graphics window.
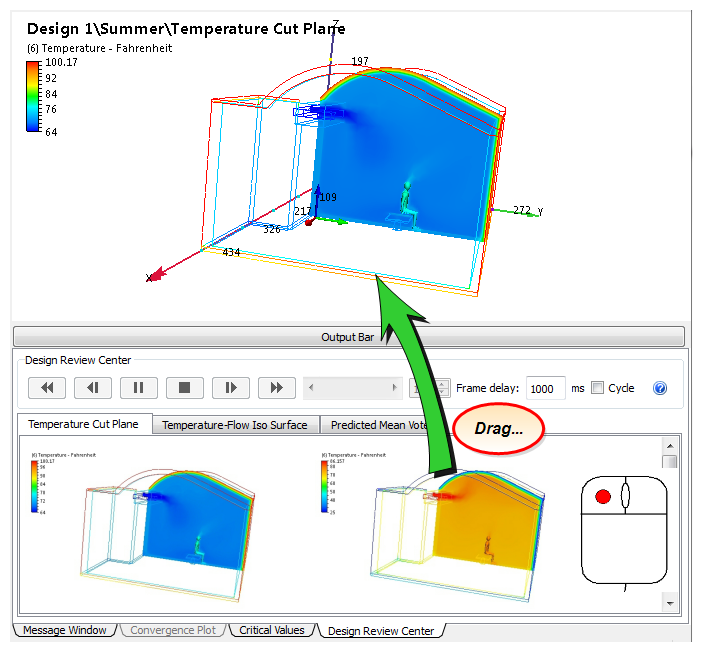
5. To compare the results from the two scenarios, click the Play button or drag the slider.
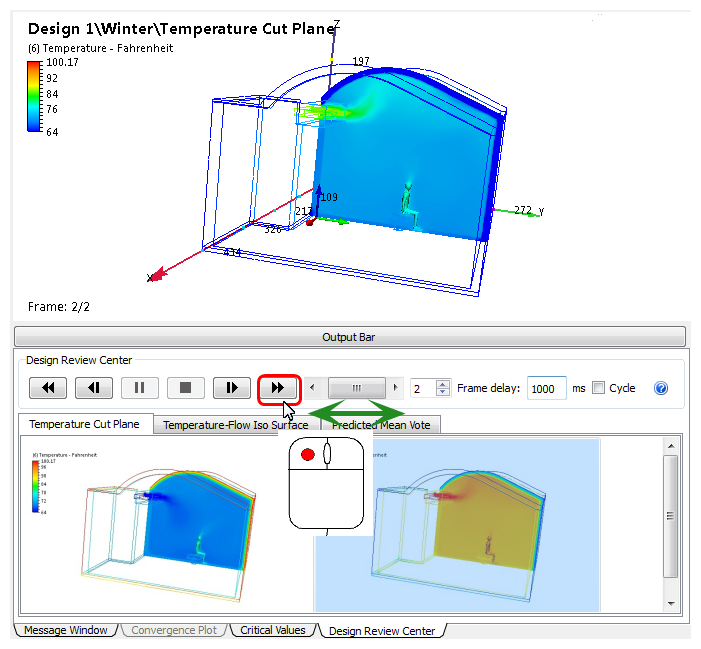
Note: After clicking Play, the two scenarios alternate in the Graphics window. This is a great way to get a direct comparison between the simulations.
|
|
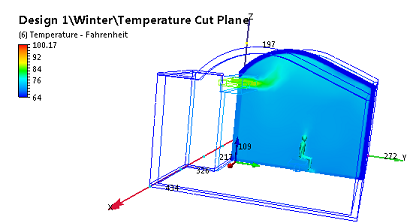
Note: These images show temperature on a cross-section that cuts through the occupant. In the Summer scenario, the cold air descends rapidly and envelopes the occupant from behind. In the Winter scenario, the warm air rises due to buoyancy, and circulates around the room.
6. When you're ready to move on, click the Stop button to halt the animation.
